
Want your robot to “see” a line without using a camera or heavy image processing? The QTR-8RC Reflectance Sensor Array gives you eight reflectance readings across a single bar, so your robot can sense where the line is under it. When the array passes over black tape on a white surface, the readings shift clearly and fast. That immediate response is why QTR arrays are a go-to choice for line followers and race-track robots.
This QTR-8RC Reflectance Sensor Array tutorial is built around a simple Serial Monitor test sketch. It calibrates the sensor first, then reads all eight channels into an array and prints them in one row. You will use the numbers to confirm basic health: every channel reacts, the output changes when you move over a line, and the values look stable when you hold the sensor still. This test step is important because it prevents you from blaming motors or code logic when the real issue is mounting, wiring, or lighting.
By the end, you will understand what “good” QTR data looks like and what common problems look like. You will also know how to set expectations for calibration time, sample rate, and sensor height. Once the raw readings make sense, you can confidently move on to position tracking, PID steering, and intersection detection. Think of this guide as your foundation for any QTR-based robot build.
Why Build?
First, it gives you a reliable way to verify the sensor before you build the full robot. Many line follower issues start with “it won’t follow,” but the real cause is often poor calibration, wrong pin order, or a sensor mounted too high. This quick test sketch makes the sensor “talk” through numbers, so you can see the truth immediately. That saves hours of guessing later.
Second, it helps you learn how reflectance behaves in real environments. Floors are not perfect white, tapes are not always deep black, and light can change throughout the day. With the Serial stream, you can test different surfaces, distances, and angles in minutes. You’ll start to see how height affects contrast and why shielding the sensor from stray light improves consistency.
Third, it teaches multi-sensor thinking, which is essential for smoother control. A single sensor only tells you “line or no line,” but an 8-sensor bar tells you where the line is relative to center. That extra information is what makes PID control possible and why robots can take curves without zigzagging. Once you learn to trust the eight values, you can build faster, smoother robots with fewer surprises.
What You’ll Learn
- What the QTR-8RC measures – How eight sensors read surface reflectance across a width, not just one spot.
- RC sensing concept – Why RC sensors use charge/discharge timing and how that becomes a usable reading.
- Pin mapping and ordering – Why pin order matters (left-to-right) and how mistakes show up in your output.
- Calibration behavior – What the 200-cycle calibration does, what it stores, and why it improves repeatability.
- Reading interpretation – How to spot a strong line signal, a weak contrast setup, or a dead channel.
- Mounting and environment – How height, tilt, and ambient light change the numbers you see.
- Test-to-build workflow – How to move from raw values → thresholds → position estimate → motor control.
What You'll Need
Fritzing Diagram
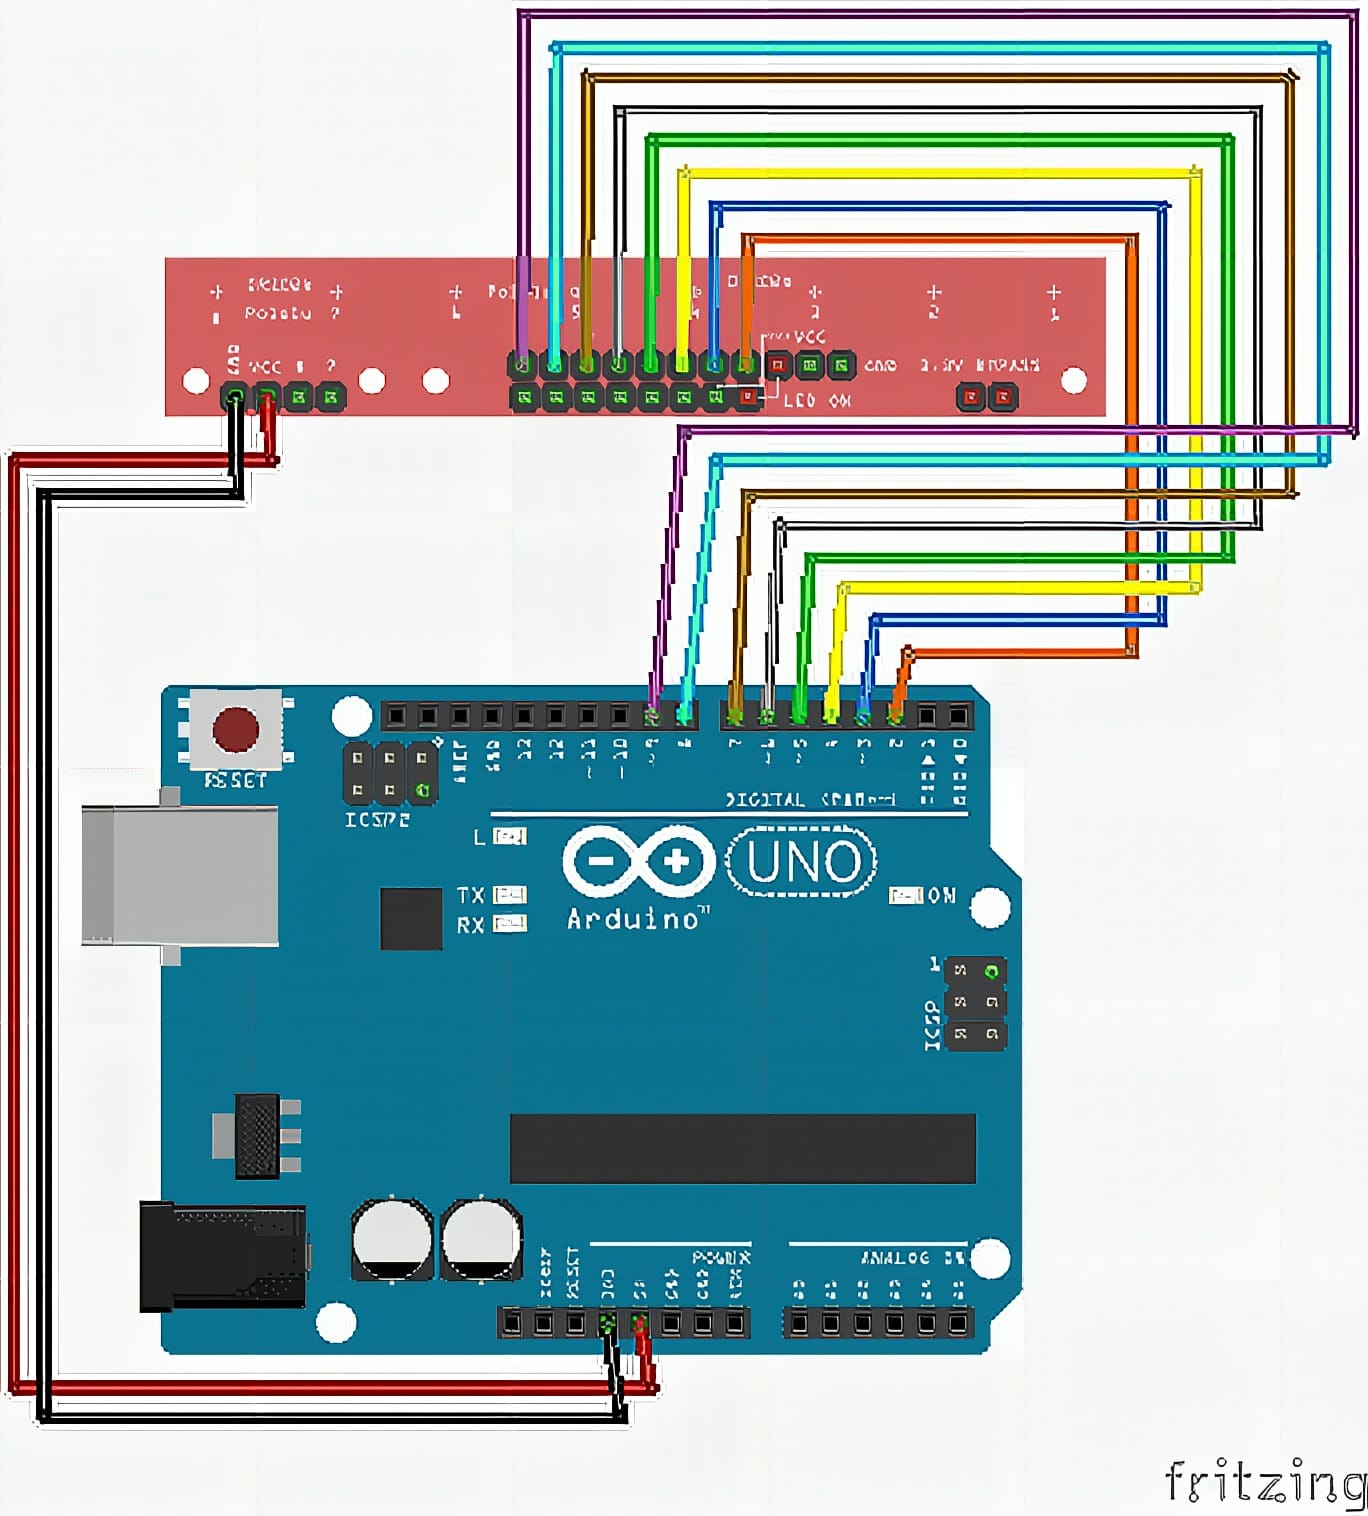
Wiring Connection
QTR-8RC Sensor Array to Arduino
- OUT1 → D2
- OUT2 → D3
- OUT3 → D4
- OUT4 → D5
- OUT5 → D6
- OUT6 → D7
- OUT7 → D8
- OUT8 → D9
Sample Code
#include <QTRSensors.h>

QTRSensorsRC qtr((unsigned char[]) {2, 3, 4, 5, 6, 7, 8, 9}, 8, 2500, QTR_NO_EMITTER_PIN);
unsigned int sensorValues[8];

void setup() {
  Serial.begin(9600);
  delay(500);

  // Calibration
  for (int i = 0; i < 200; i++) {
    qtr.calibrate();
    delay(20);
  }

  Serial.println("Calibration done");
}

void loop() {
  qtr.read(sensorValues);

  for (int i = 0; i < 8; i++) {
    Serial.print(sensorValues[i]);
    Serial.print('\t');
  }
  Serial.println();

  delay(200);
}
How It Works
The sketch starts by creating a QTRSensorsRC object that knows which Arduino pins the array uses. In the sample code, it uses pins 2 through 9 and defines there are 8 sensors. The “RC” mode means each sensor reading is based on timing how long it takes a charged node to discharge, which changes depending on reflected IR light. A timeout value helps prevent the program from waiting too long in extreme cases.
During setup(), the sketch runs a calibration loop about 200 times. Calibration is not just a formality; it teaches the library what “dark” and “light” look like for your environment and your mounting height. While calibrating, you should slowly move the sensor over both the line and the background so each channel experiences its real range. When calibration finishes, you get a message in Serial so you know you can start testing real reads.
In the main loop, qtr.read(sensorValues) fills the sensorValues[8] array with the latest readings. The code prints each value with tab spacing so the row is easy to compare across sensors. When you slide the array across the line, you should see the “strong change” move from left channels to right channels depending on where the line sits. If all channels stay flat, raise contrast (use darker tape), lower sensor height, or reduce ambient light hitting the board.
The delay(200) keeps output readable and prevents the Serial Monitor from flooding. For real robots you usually reduce that delay, but for learning it’s perfect. It lets you pause the sensor over a line and observe which channels react most. It also makes it easy to test edge cases like sensor drift, surface glare, or weak tape without losing track of the data.
Applications & Extensions
The most direct next step is a line-following robot. Once you know the sensor values change correctly, you can compute a line position and steer using differential motor speed. The QTR-8RC Reflectance Sensor Array gives you enough resolution to take curves smoothly and detect when the line shifts off center. It also helps with track racing where small steering corrections matter.
You can extend the test sketch into a more useful diagnostic tool. Print the min/max range learned during calibration so you can confirm every channel saw both surfaces. Add a “normalized” print mode so values become easier to compare across channels and sessions. You can also add a simple threshold to output 0/1 flags per sensor, which helps you debug intersection patterns like T-junctions or finish lines.
For advanced behavior, compute a weighted average of sensor indexes to estimate the line’s center position. Then feed that position into a PID controller for smooth steering. You can also detect intersections by counting how many sensors see the line at once. If you run in bright areas, add a small shield or hood over the array to block stray light and improve stability.
Finally, you can combine the QTR-8RC Reflectance Sensor Array with other sensors for smarter robots. Use an ultrasonic sensor for obstacle awareness, or add an IMU to help control during sharp turns. If you design a robot for different tracks, create a quick “calibration routine” button so you can recalibrate on demand. With clean sensor data, every other part of your robot becomes easier to tune and more reliable.
Watch the Full Demo Video
Here’s the QTR-8RC Reflectance Sensor Array.
Frequently Asked Questions
What does this QTR-8RC Reflectance Sensor Array tutorial cover?
Want your robot to “see” a line without using a camera or heavy image processing? The QTR-8RC Reflectance Sensor Array gives you eight reflectance readings across a single bar, so your robot can sense where the line is under it.
What's the working voltage of the QTR-8RC Reflectance Sensor Array?
Check the Sample Code section for the exact pinout — most maker-grade sensors run on 3.3V or 5V. Wire VCC to the matching rail, GND common with your MCU, data to a digital or analog pin.
Why does the QTR-8RC Reflectance Sensor Array read garbage or saturated values?
Three usual causes: wrong voltage rail, missing pull-up resistor on I2C lines (4.7k–10k to VCC), or a floating data pin. Double-check wiring against the diagram, then probe with a multimeter.