

Gone are the days of plain data visualization! In this tutorial, we are going to create a temperature and humidity Adafruit IO dashboard using NodeMCU.
Introduction
So far we have discussed three topics about ESP8266. On one of them, we made a simple web server that displays the real-time temperature and humidity of a room. See the outcome of the tutorial below.
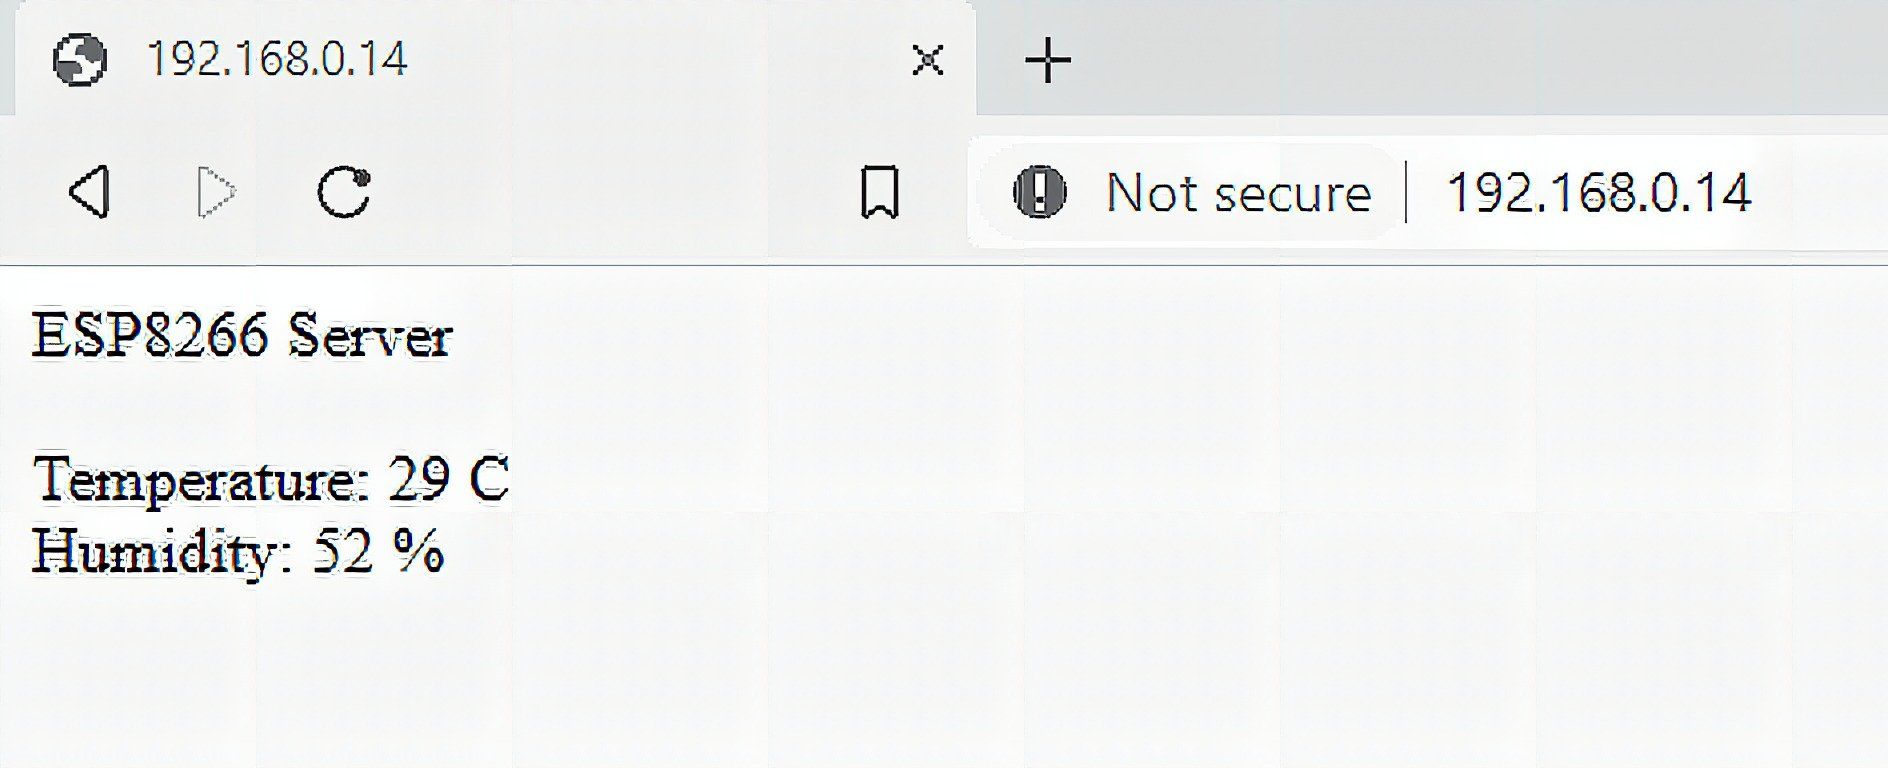
Imagine someone new to Arduino seeing something like this. Us makers might see this in rose-tinted glasses but for a beginner, this uninspiring design might make them lose interest.
That’s where Adafruit IO comes to the rescue.
Adafruit IO
Adafruit IO is a free web platform made by Adafruit Industries that acts as a control panel for any kind of data. It is designed not just to display data but to respond and interact with it as well. Here are a few things you can do with the platform:
- Real-time visualization of your data online
- Access your interface anywhere via the internet
- Connect your project to other web services and other internet-enabled devices
In order to create our sample project, here are some terms you need to learn first:
- Dashboard – offers graphs, charts, logs, and many more visualization techniques for your data.
- Trigger – reacts to your data. For example, you can use a trigger to send you an email when the temperature reading of a sensor exceeds a threshold value.
- Feed – contains the data you upload to Adafruit IO. The feed also holds the date and time when your data was uploaded.
Now that your feet are wet, we start by setting up Adafruit IO.
Setting up Adafruit IO
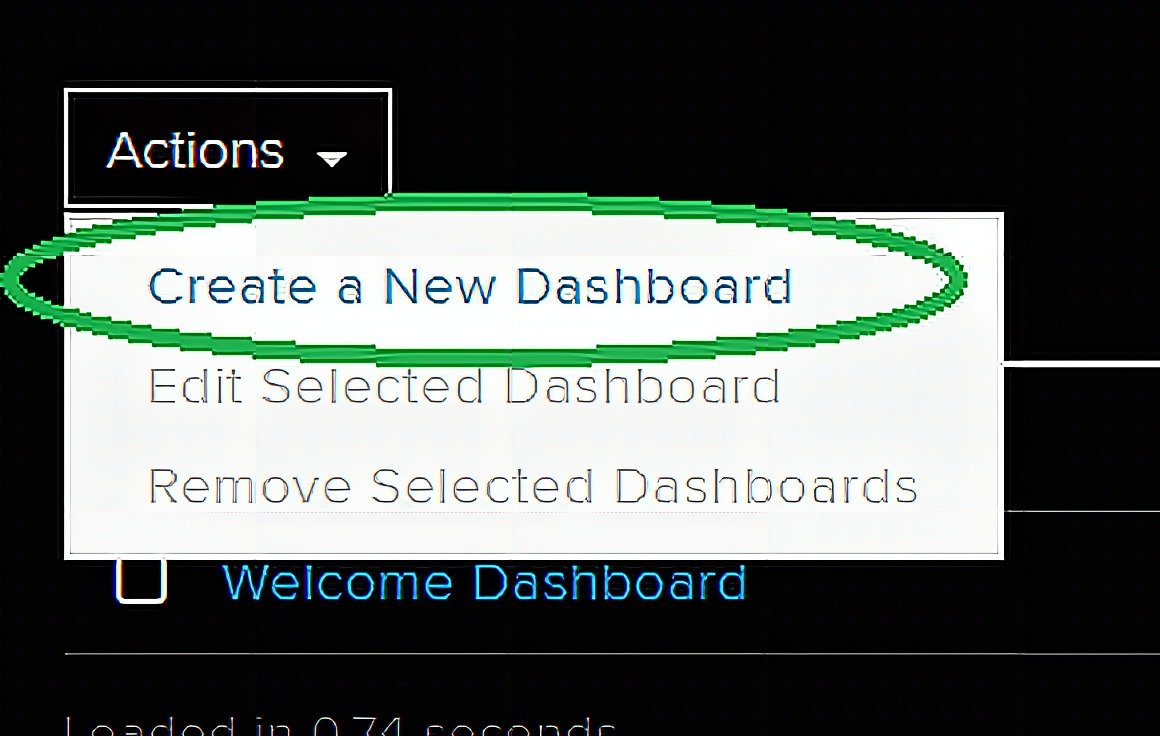
First, go to https://io.adafruit.com/ and create an account. Once logged in, go to the home page. Under Actions, select Create a New Dashboard.
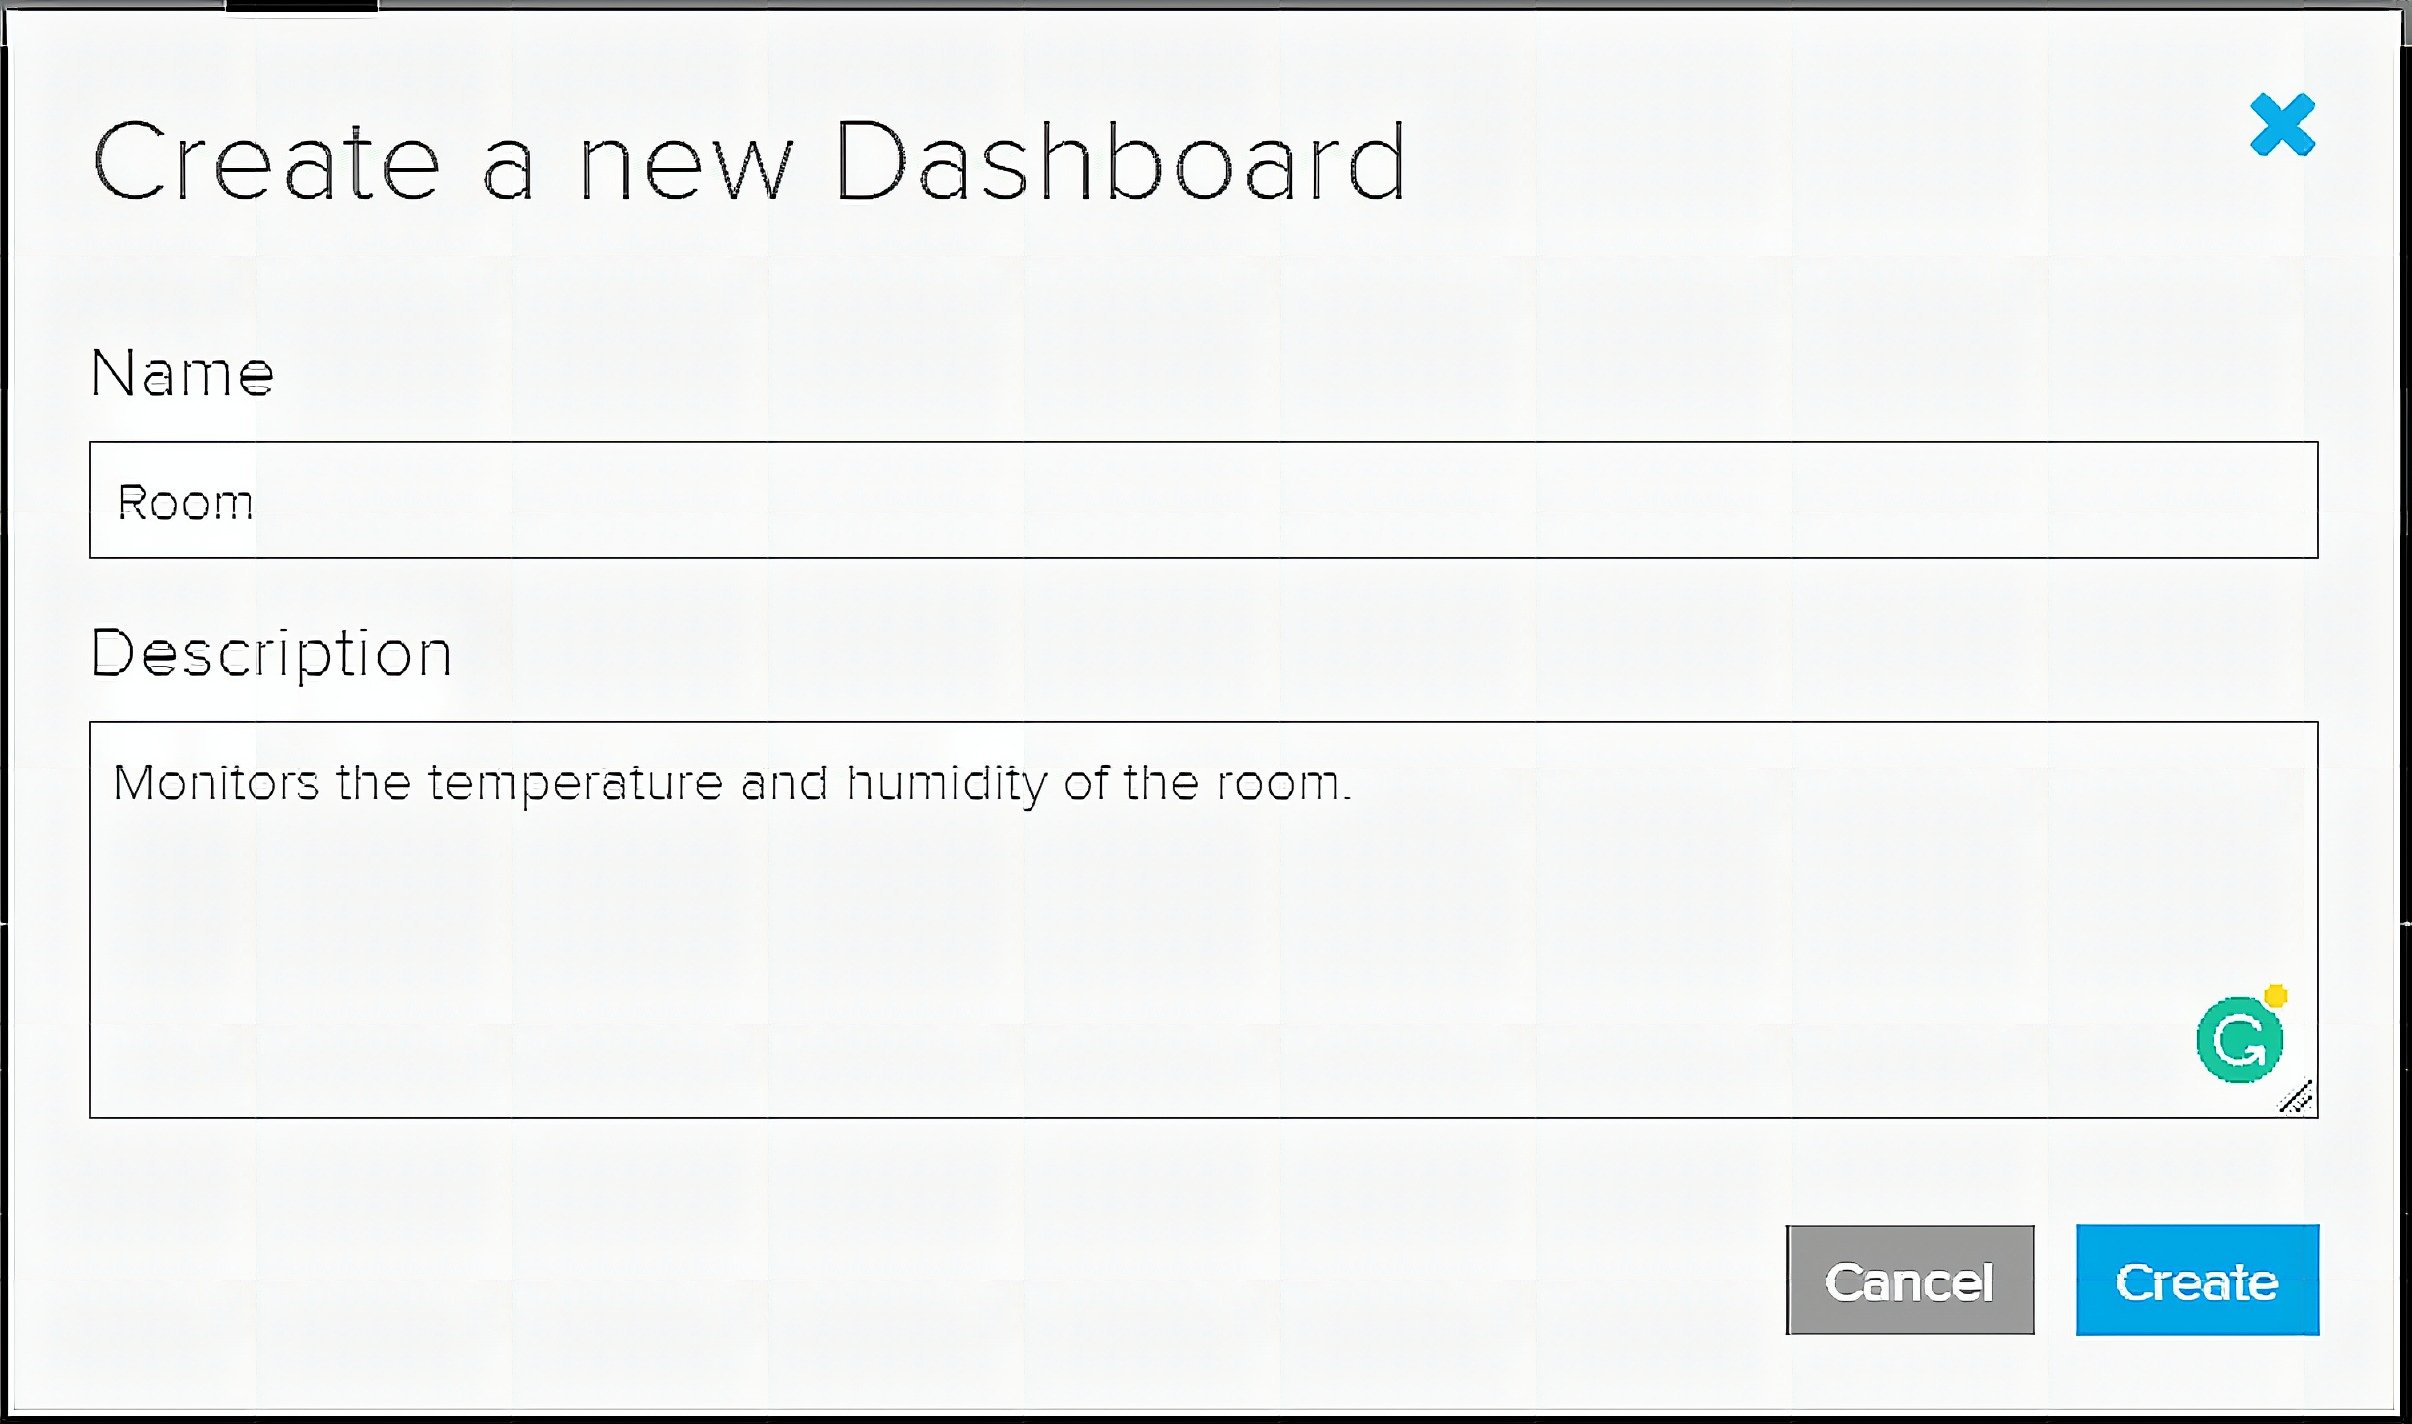
Then, after giving the dashboard a name and a short description, press create.
Next, go to your new Dashboard.
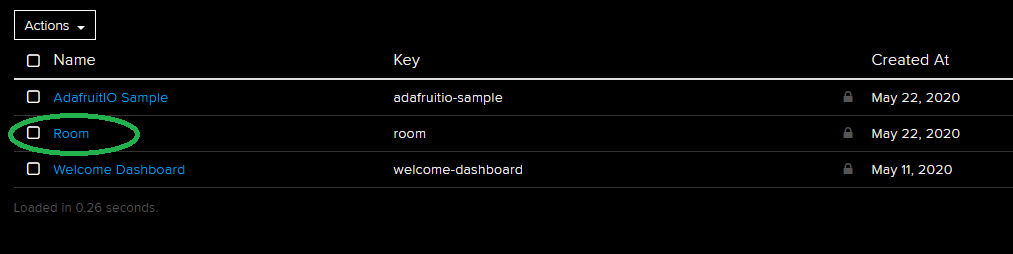
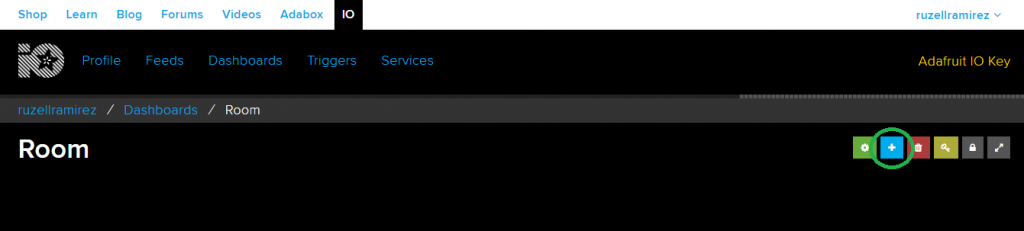
As you can see, the dashboard is still empty. You should populate it first by creating a new block. In order to do that, press the blue plus button on the right side of the dashboard.
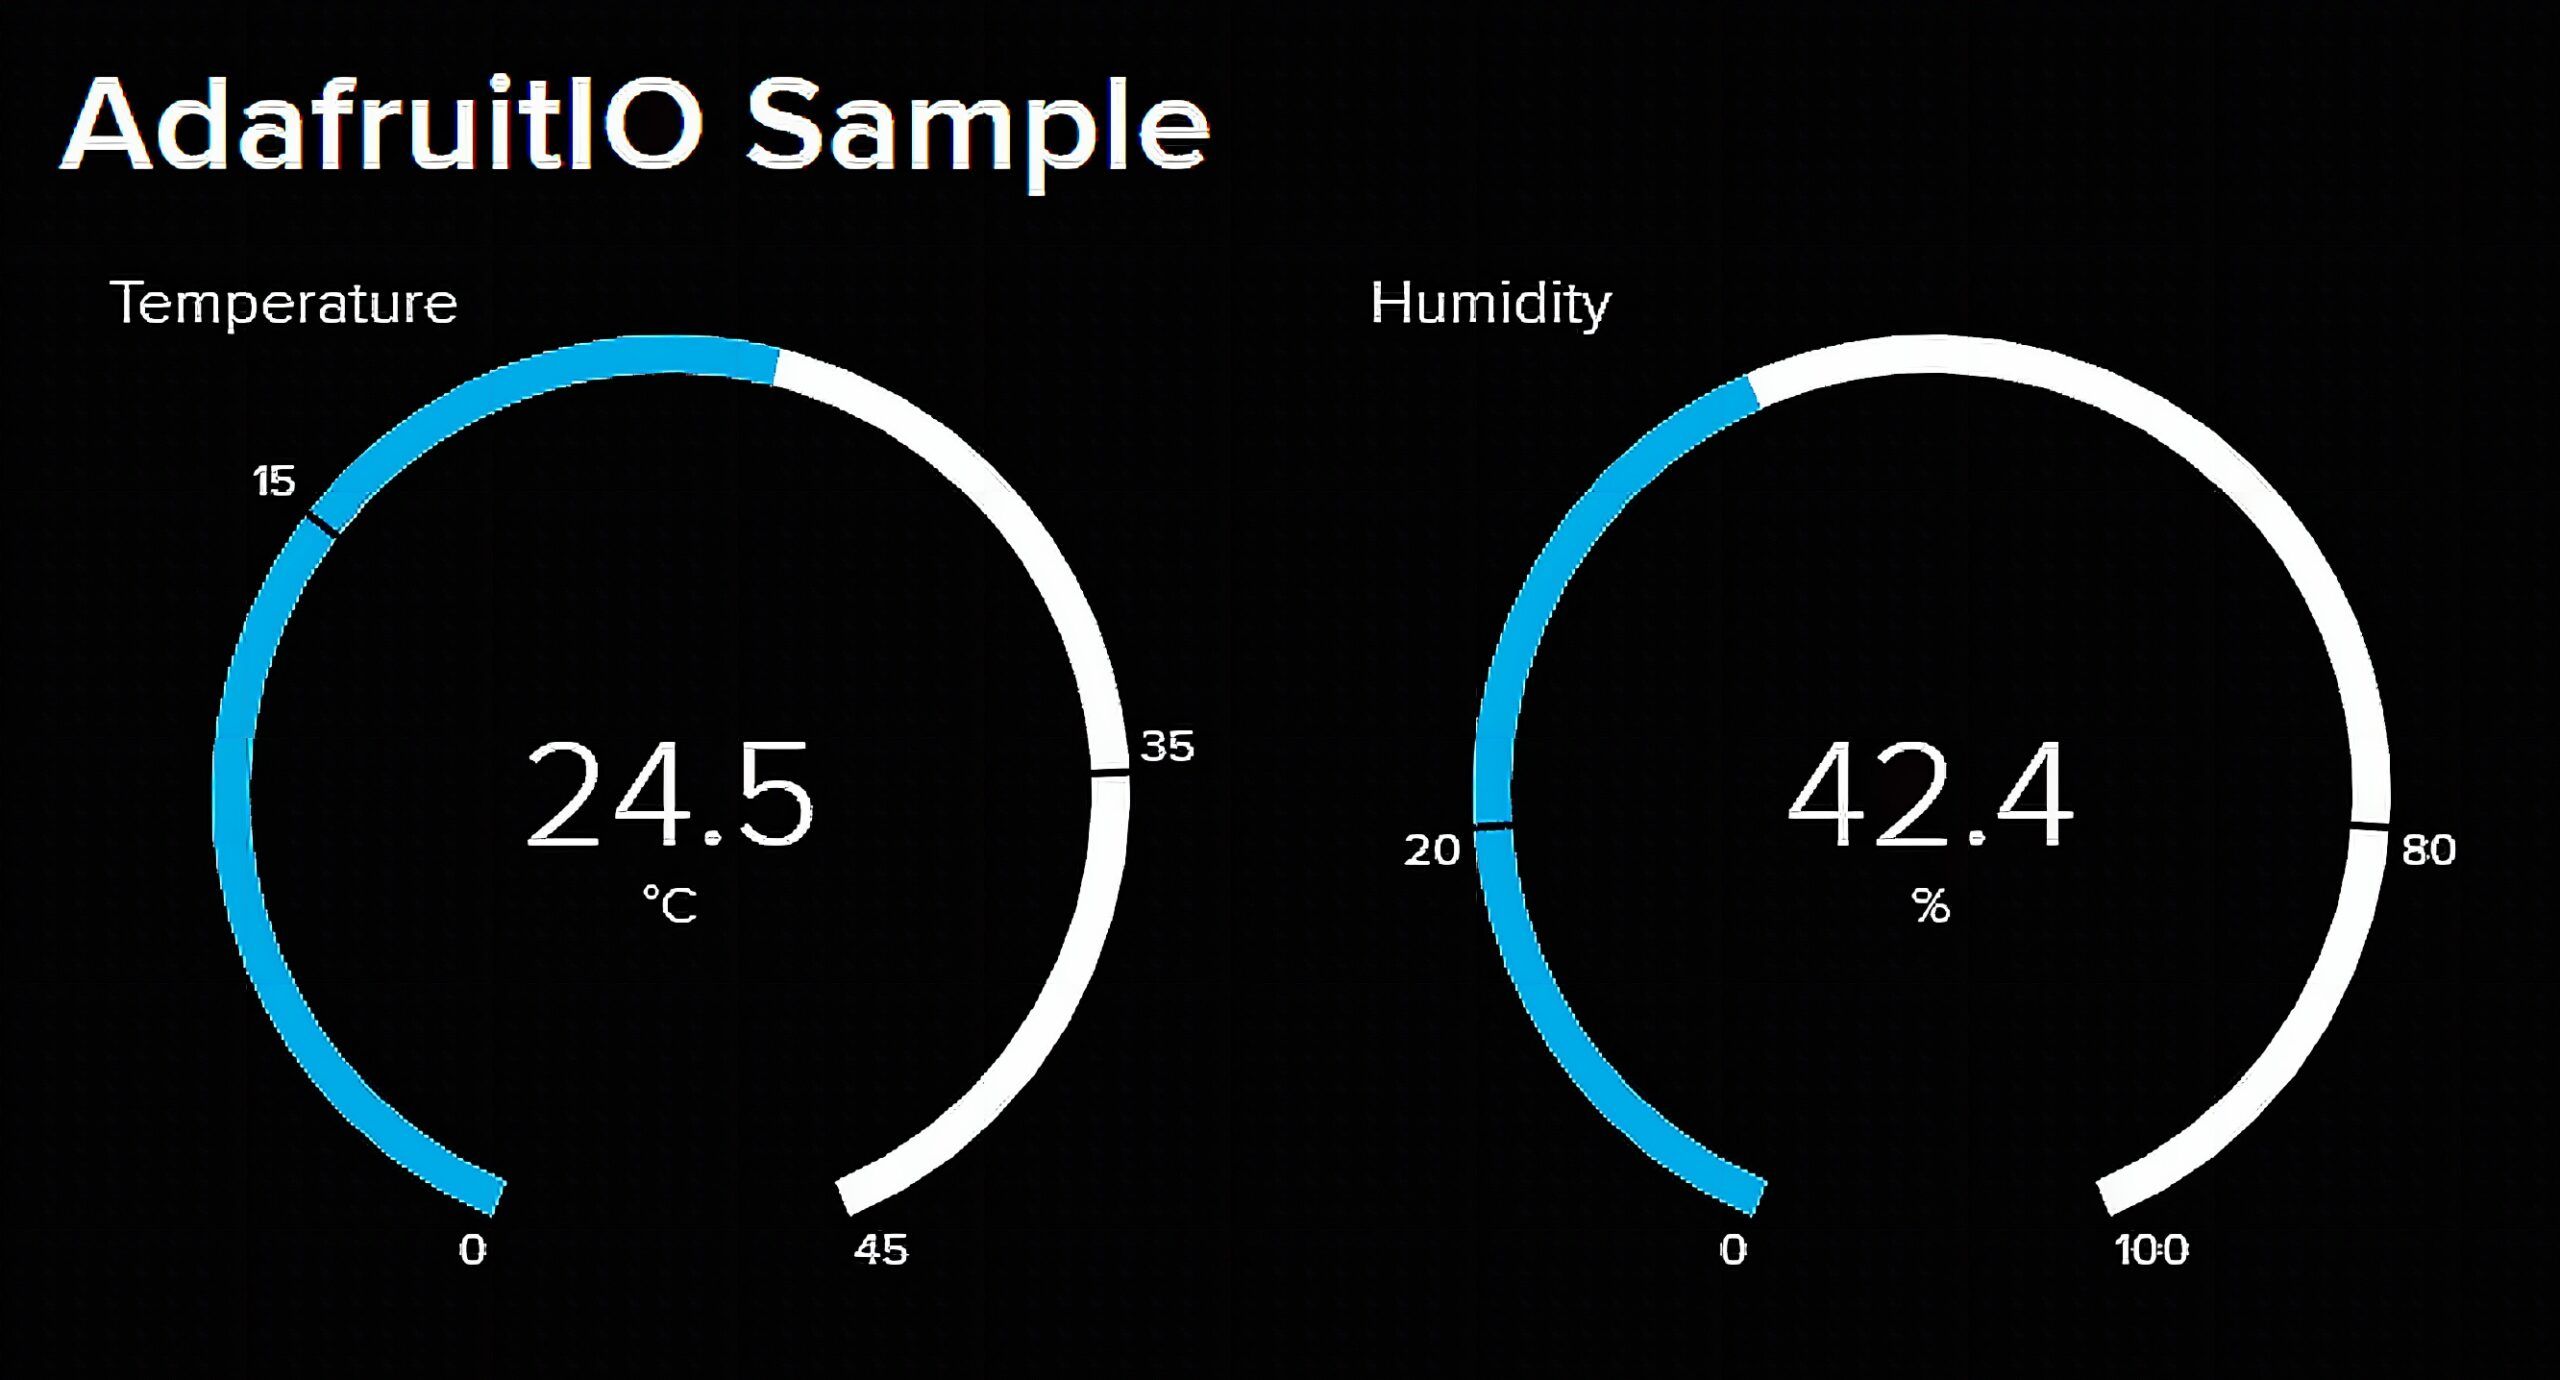
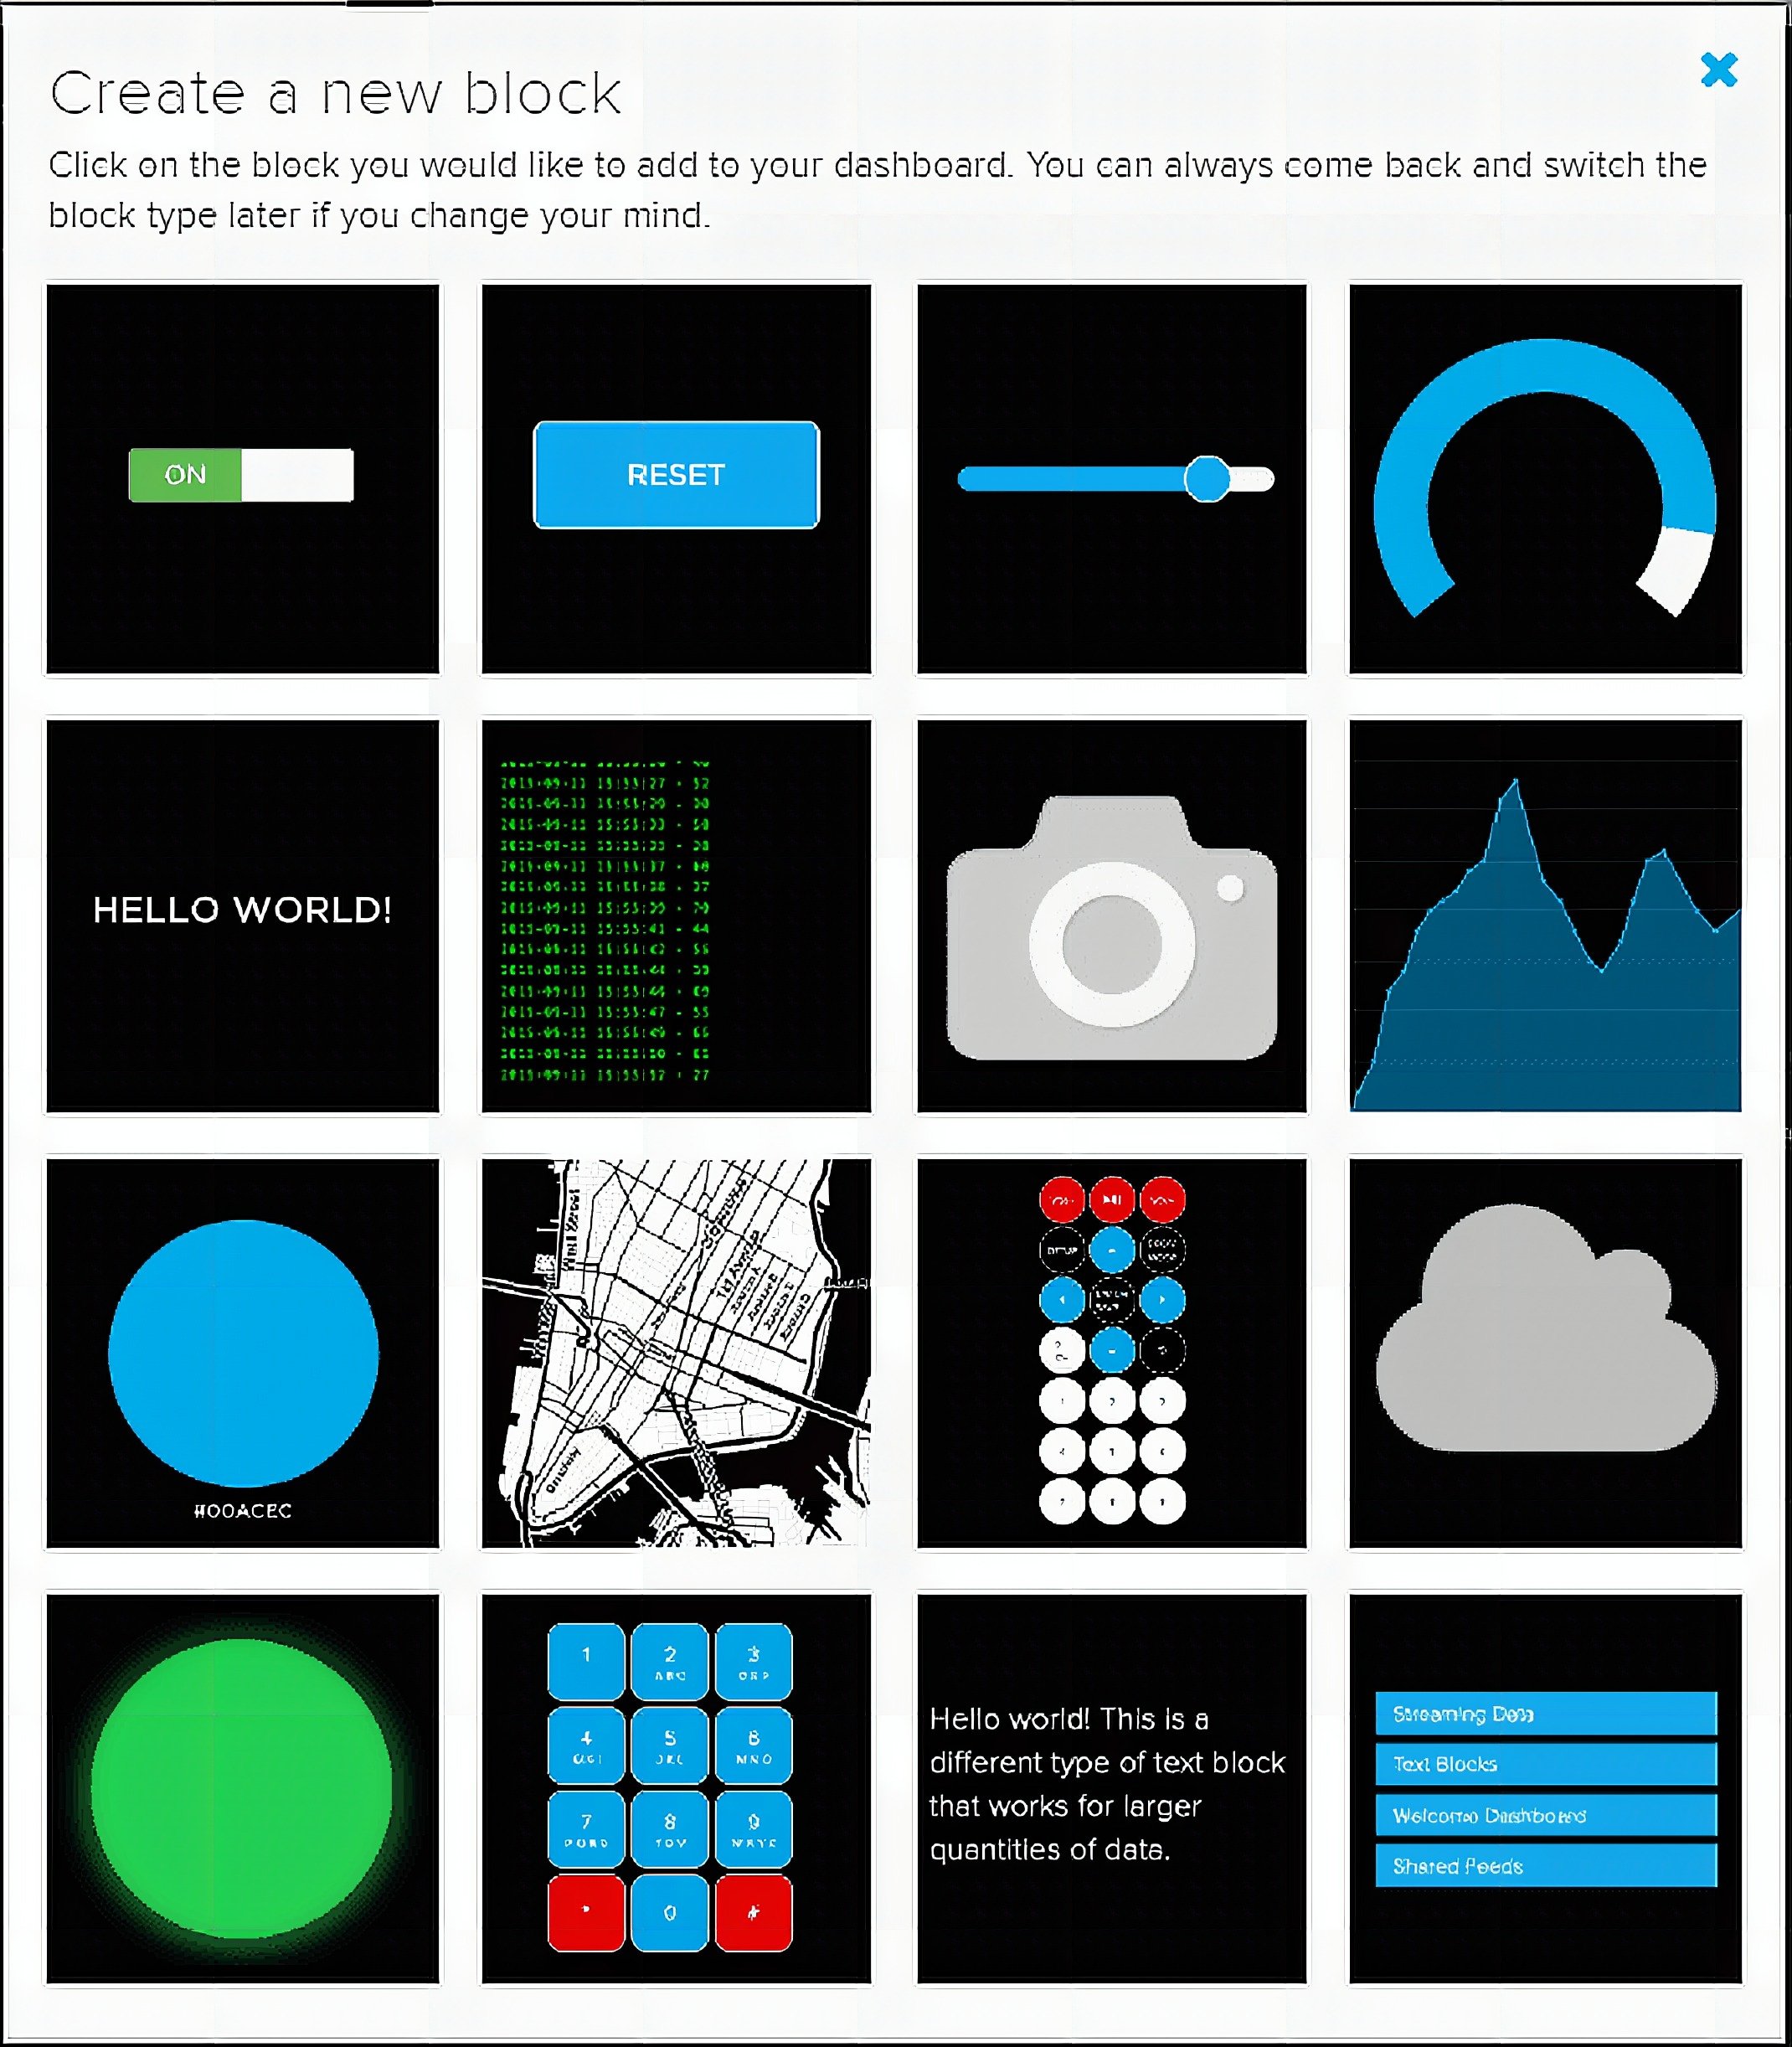
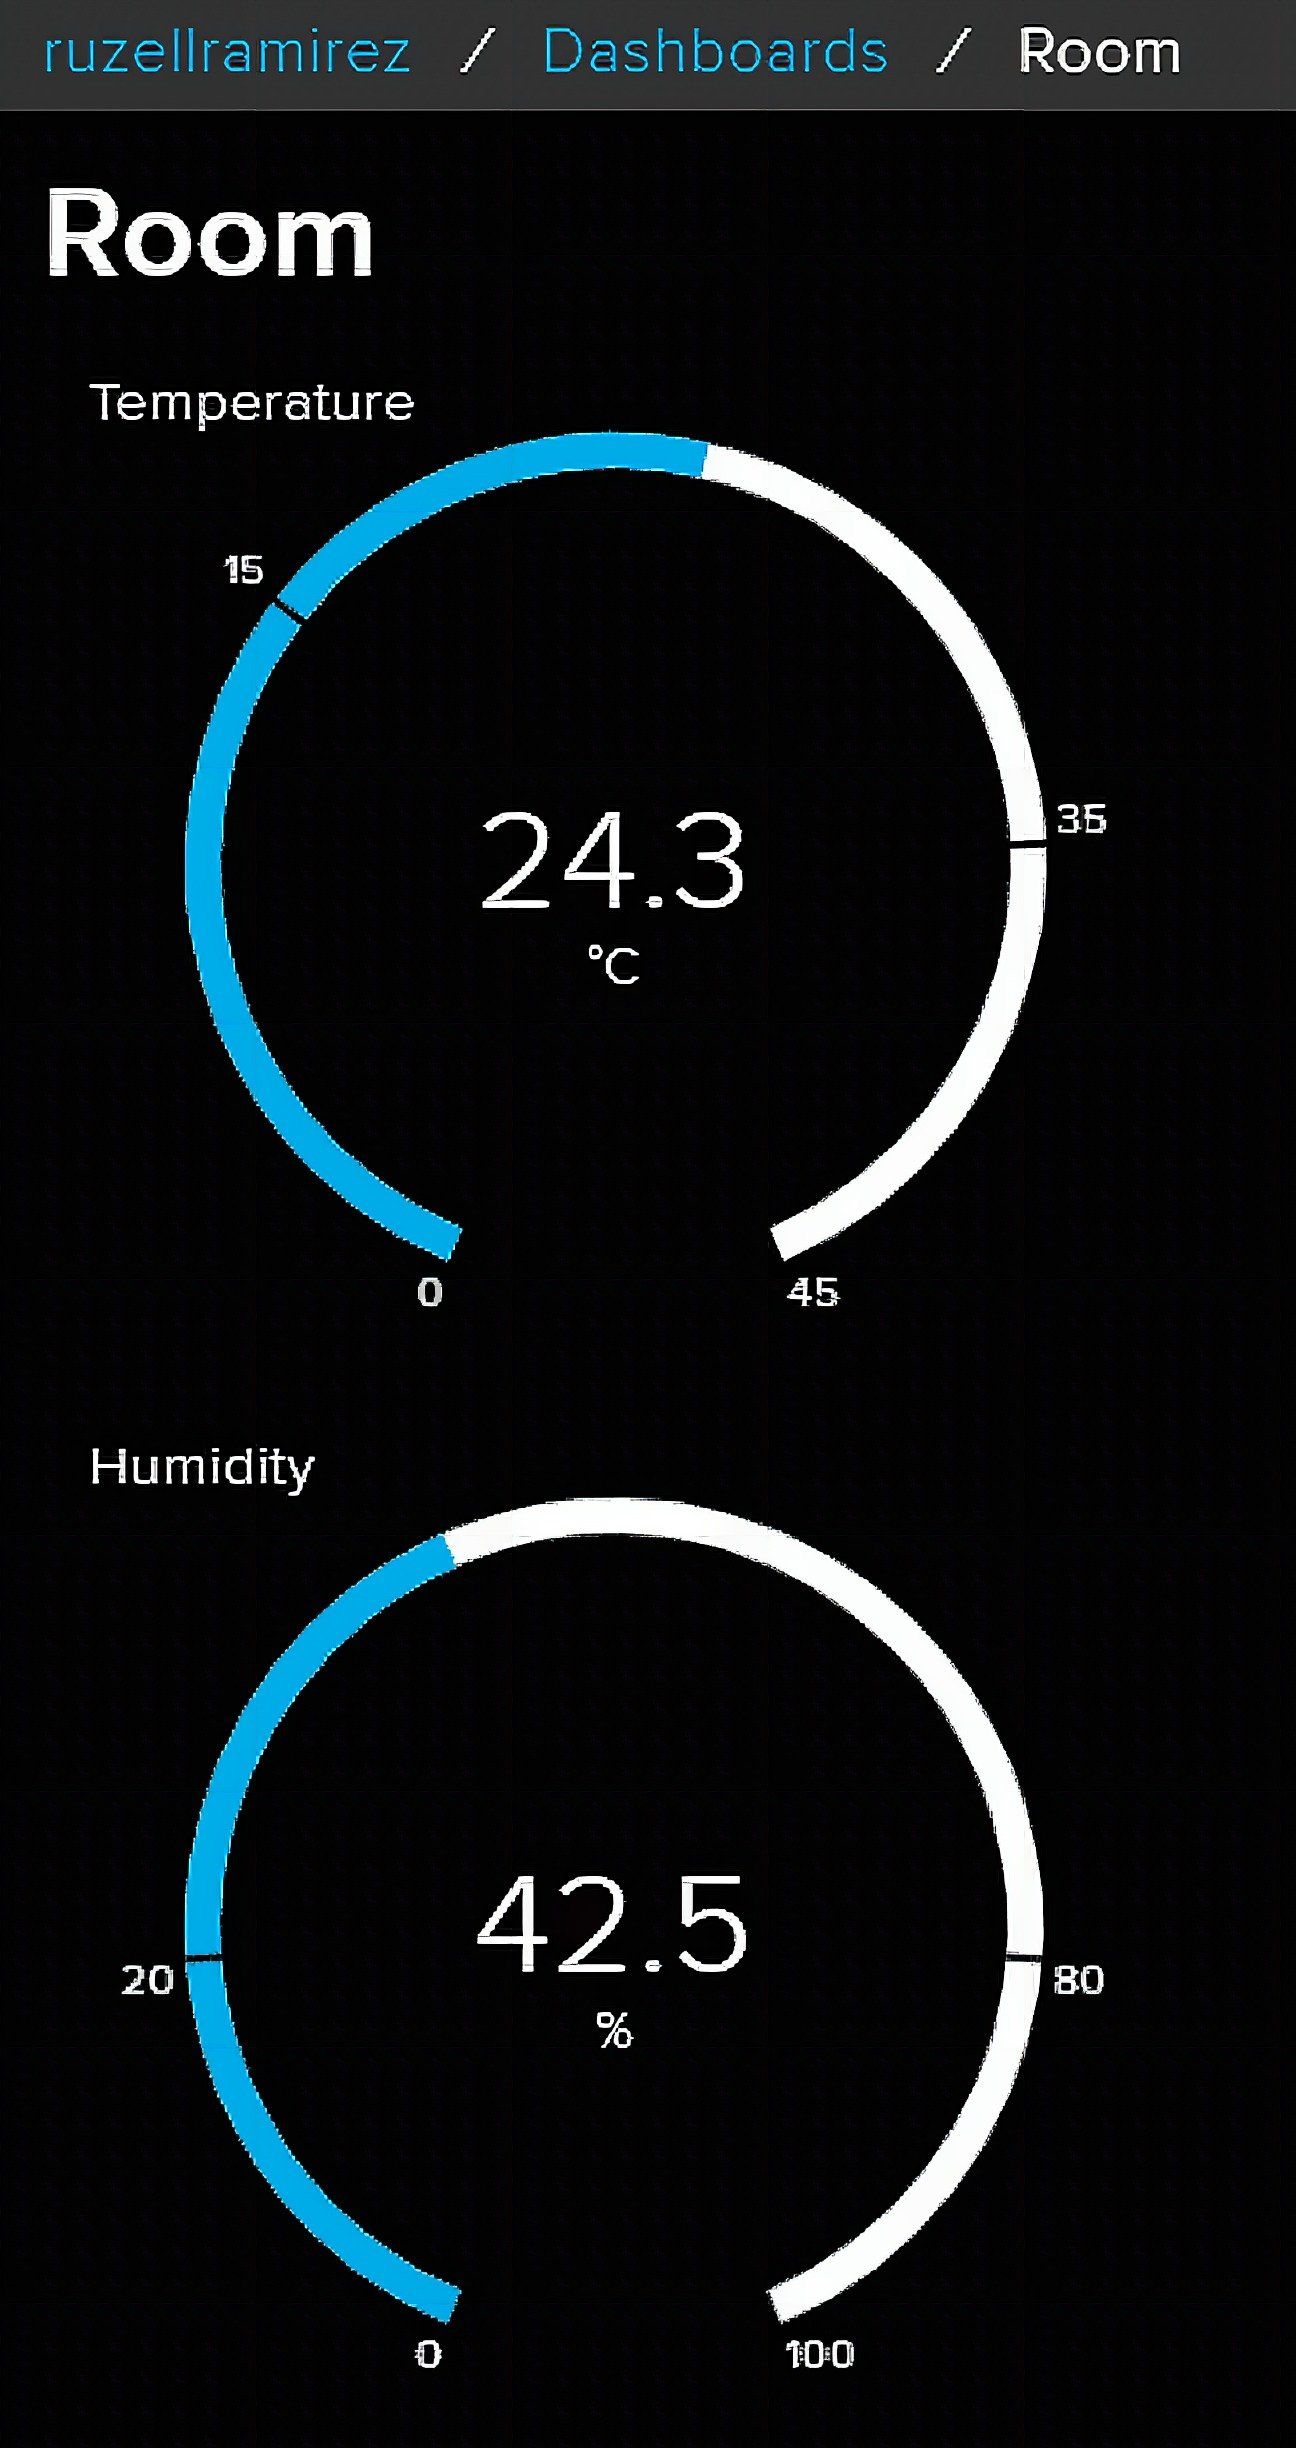
Blocks are switches, buttons, levers, gauges, and more visualization techniques that represent and react to your data. For our sample project, we need 2 gauges to display the room’s temperature and humidity.
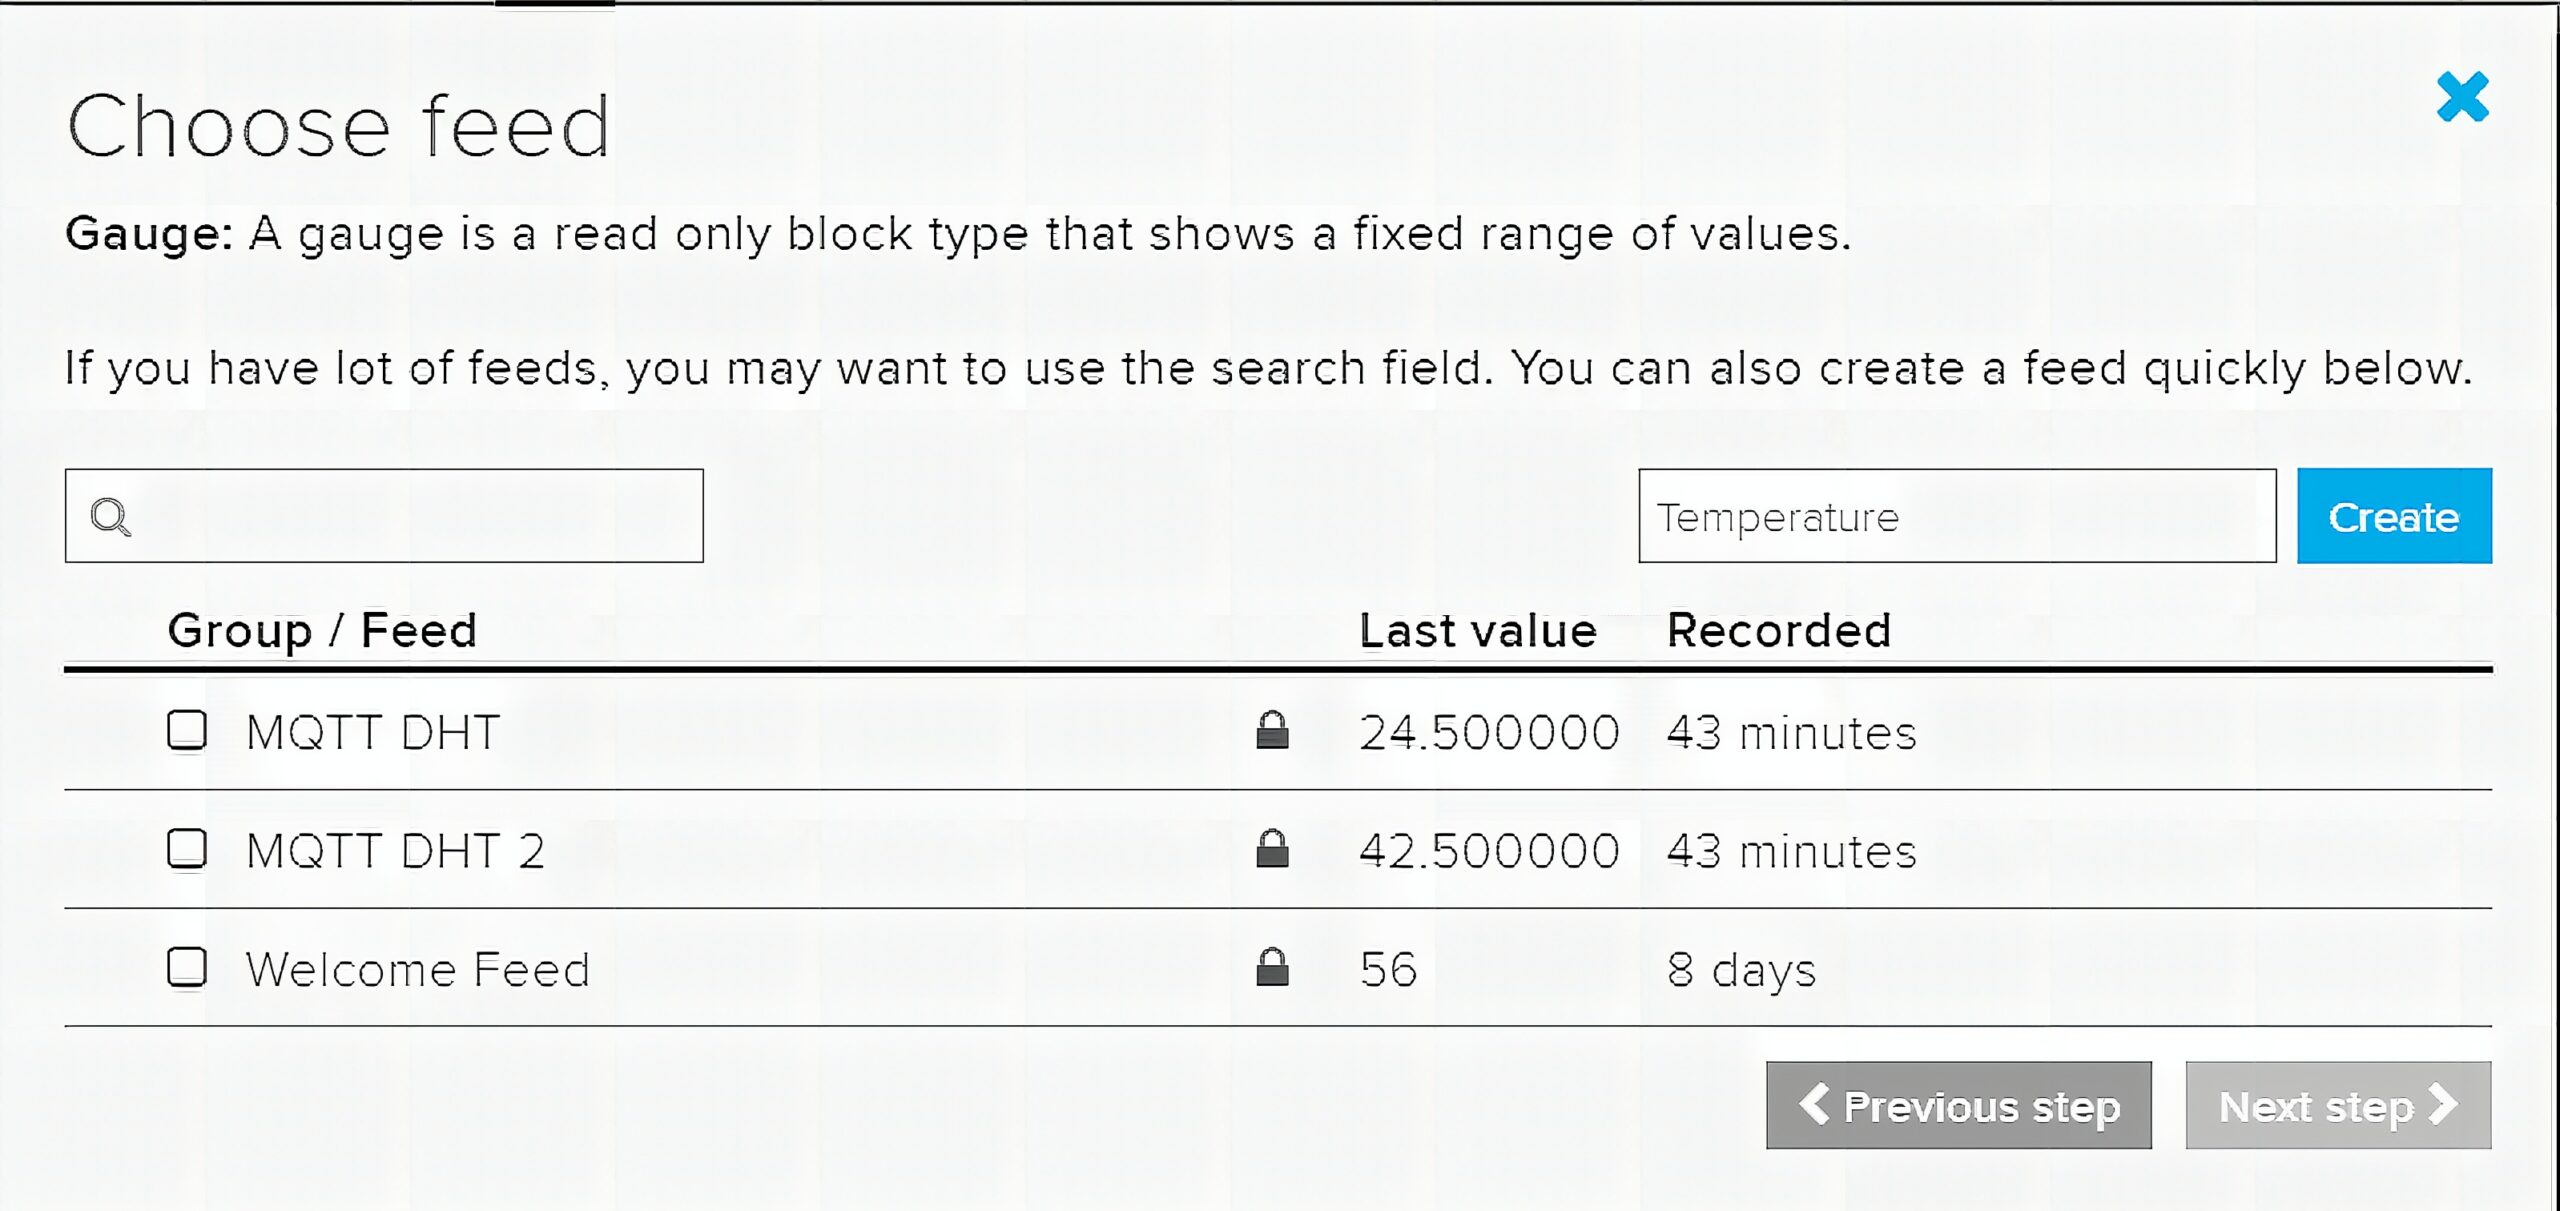
After selecting a block, Adafruit prompts you to choose a feed. We need two feeds to hold the temperature and humidity values of the DHT sensor. Create a feed using the create button on the right.
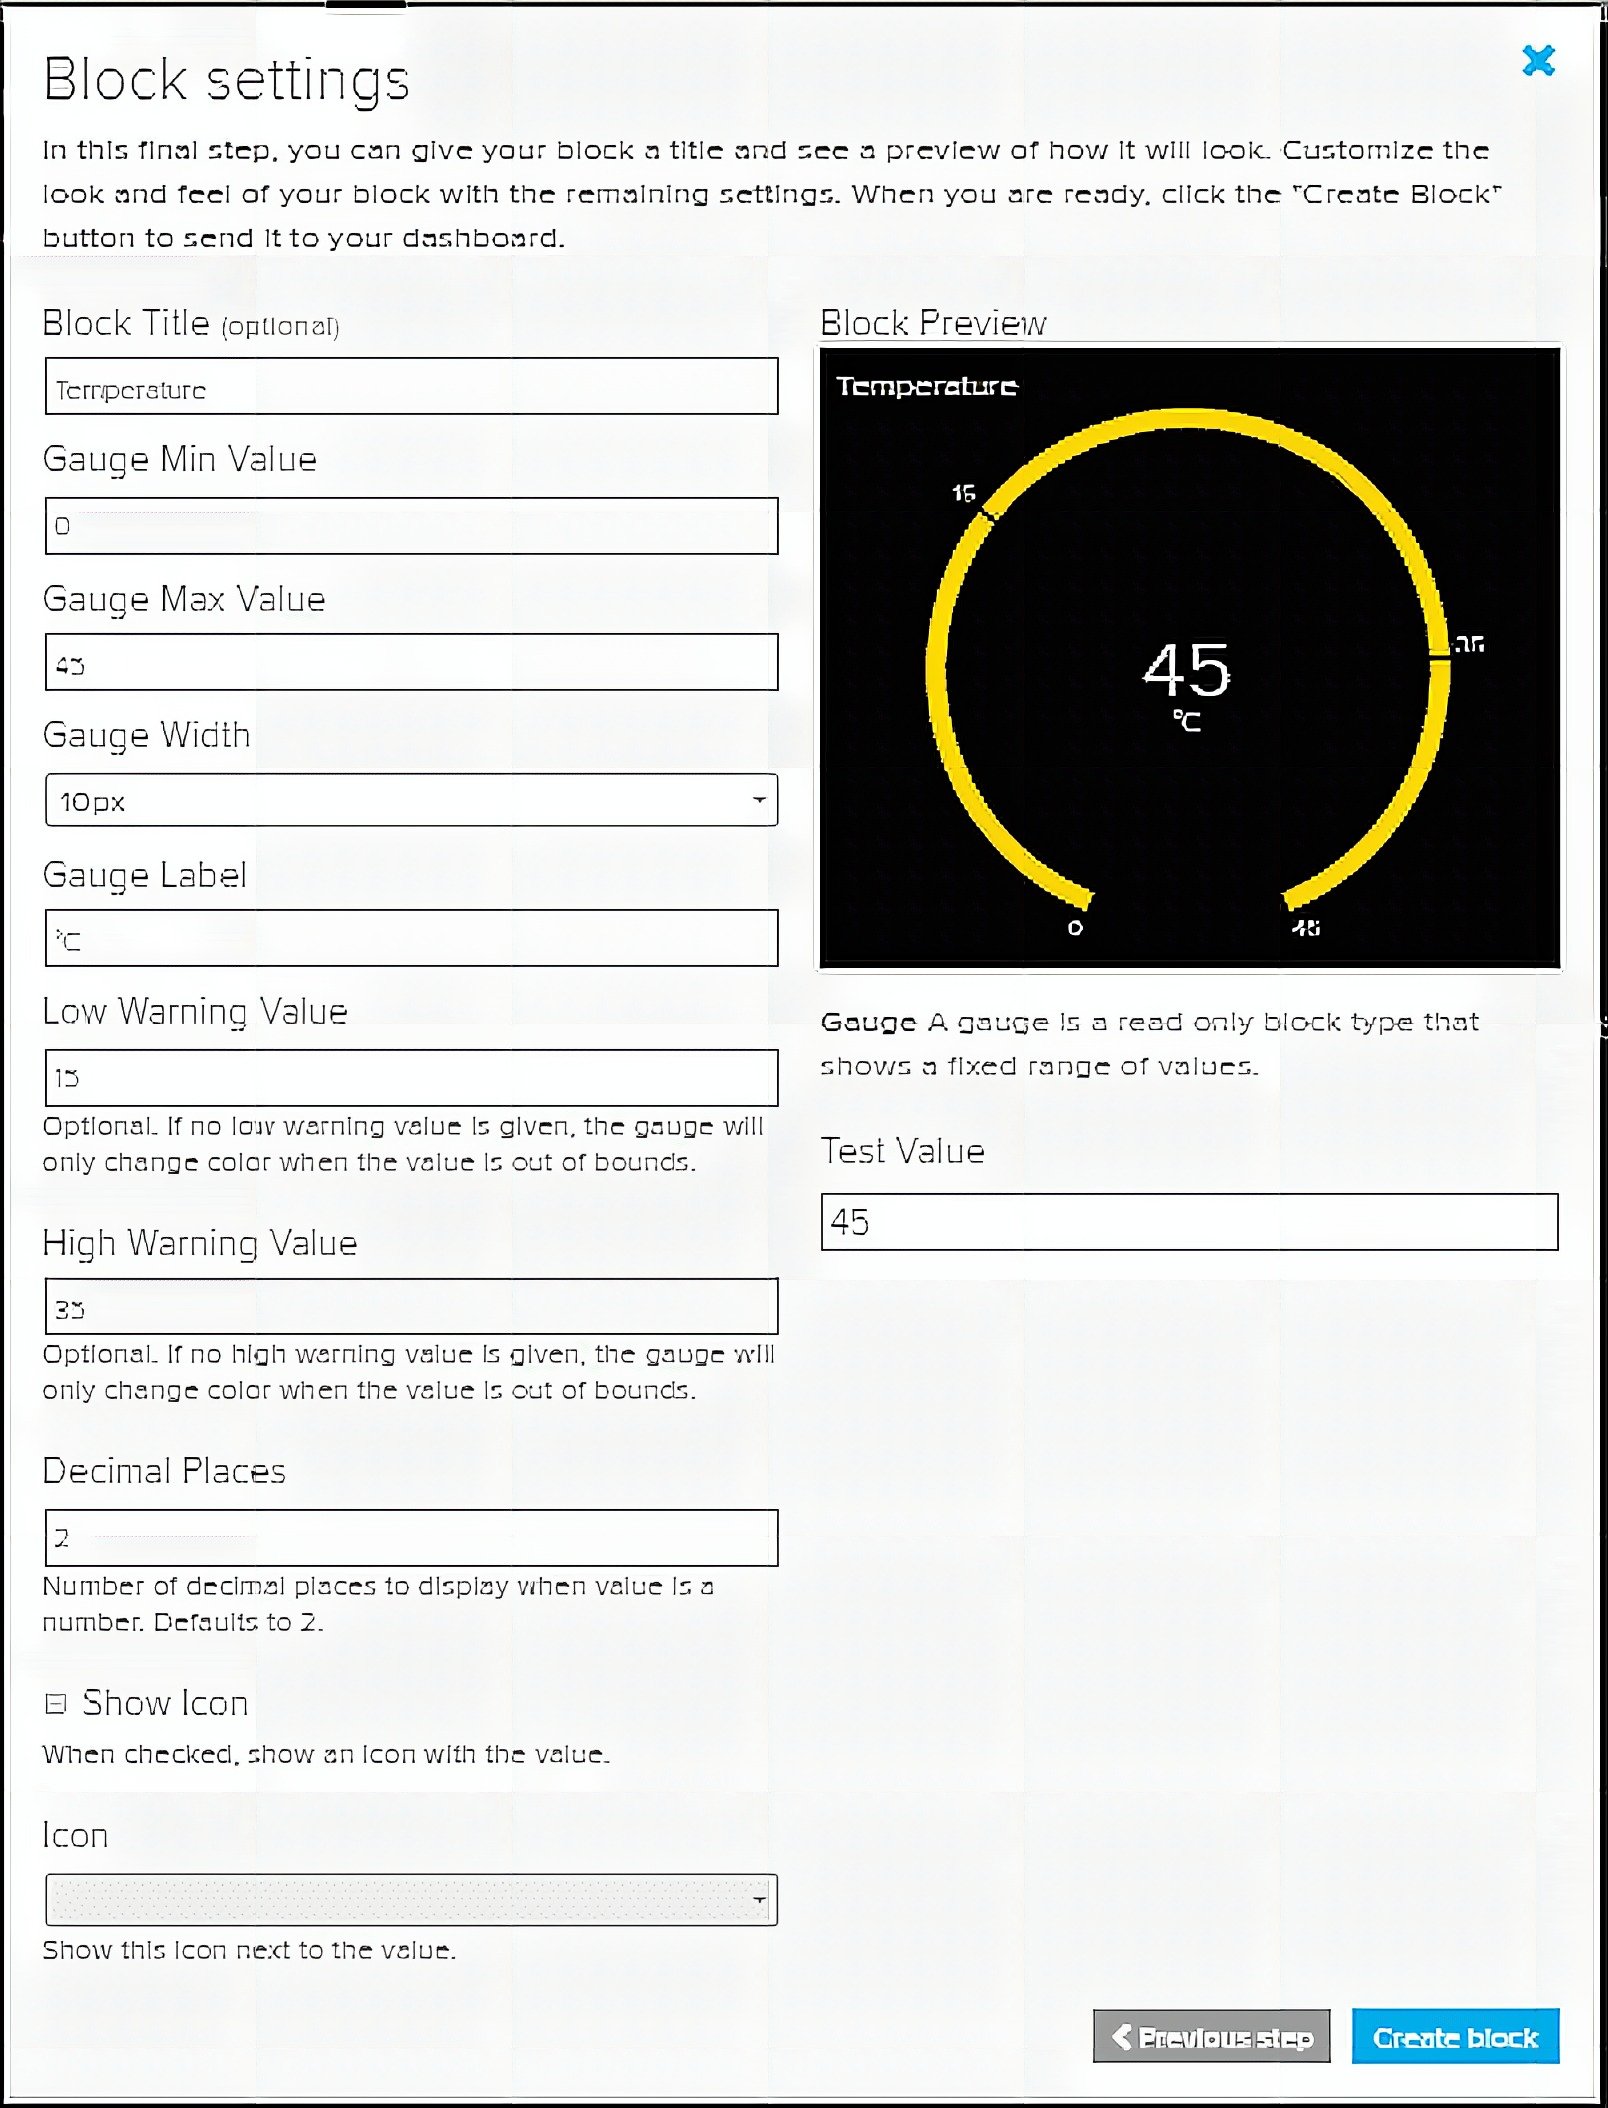
Next, configure the block settings as shown below. I set the minimum and maximum temperature to 0 and 45. Nothing scientific, completely ballparked. Furthermore, you have the option to change the width of the gauge as well. You can also place a warning indicator when the values go lower or higher to the values you have set. Create the block once you’re done.
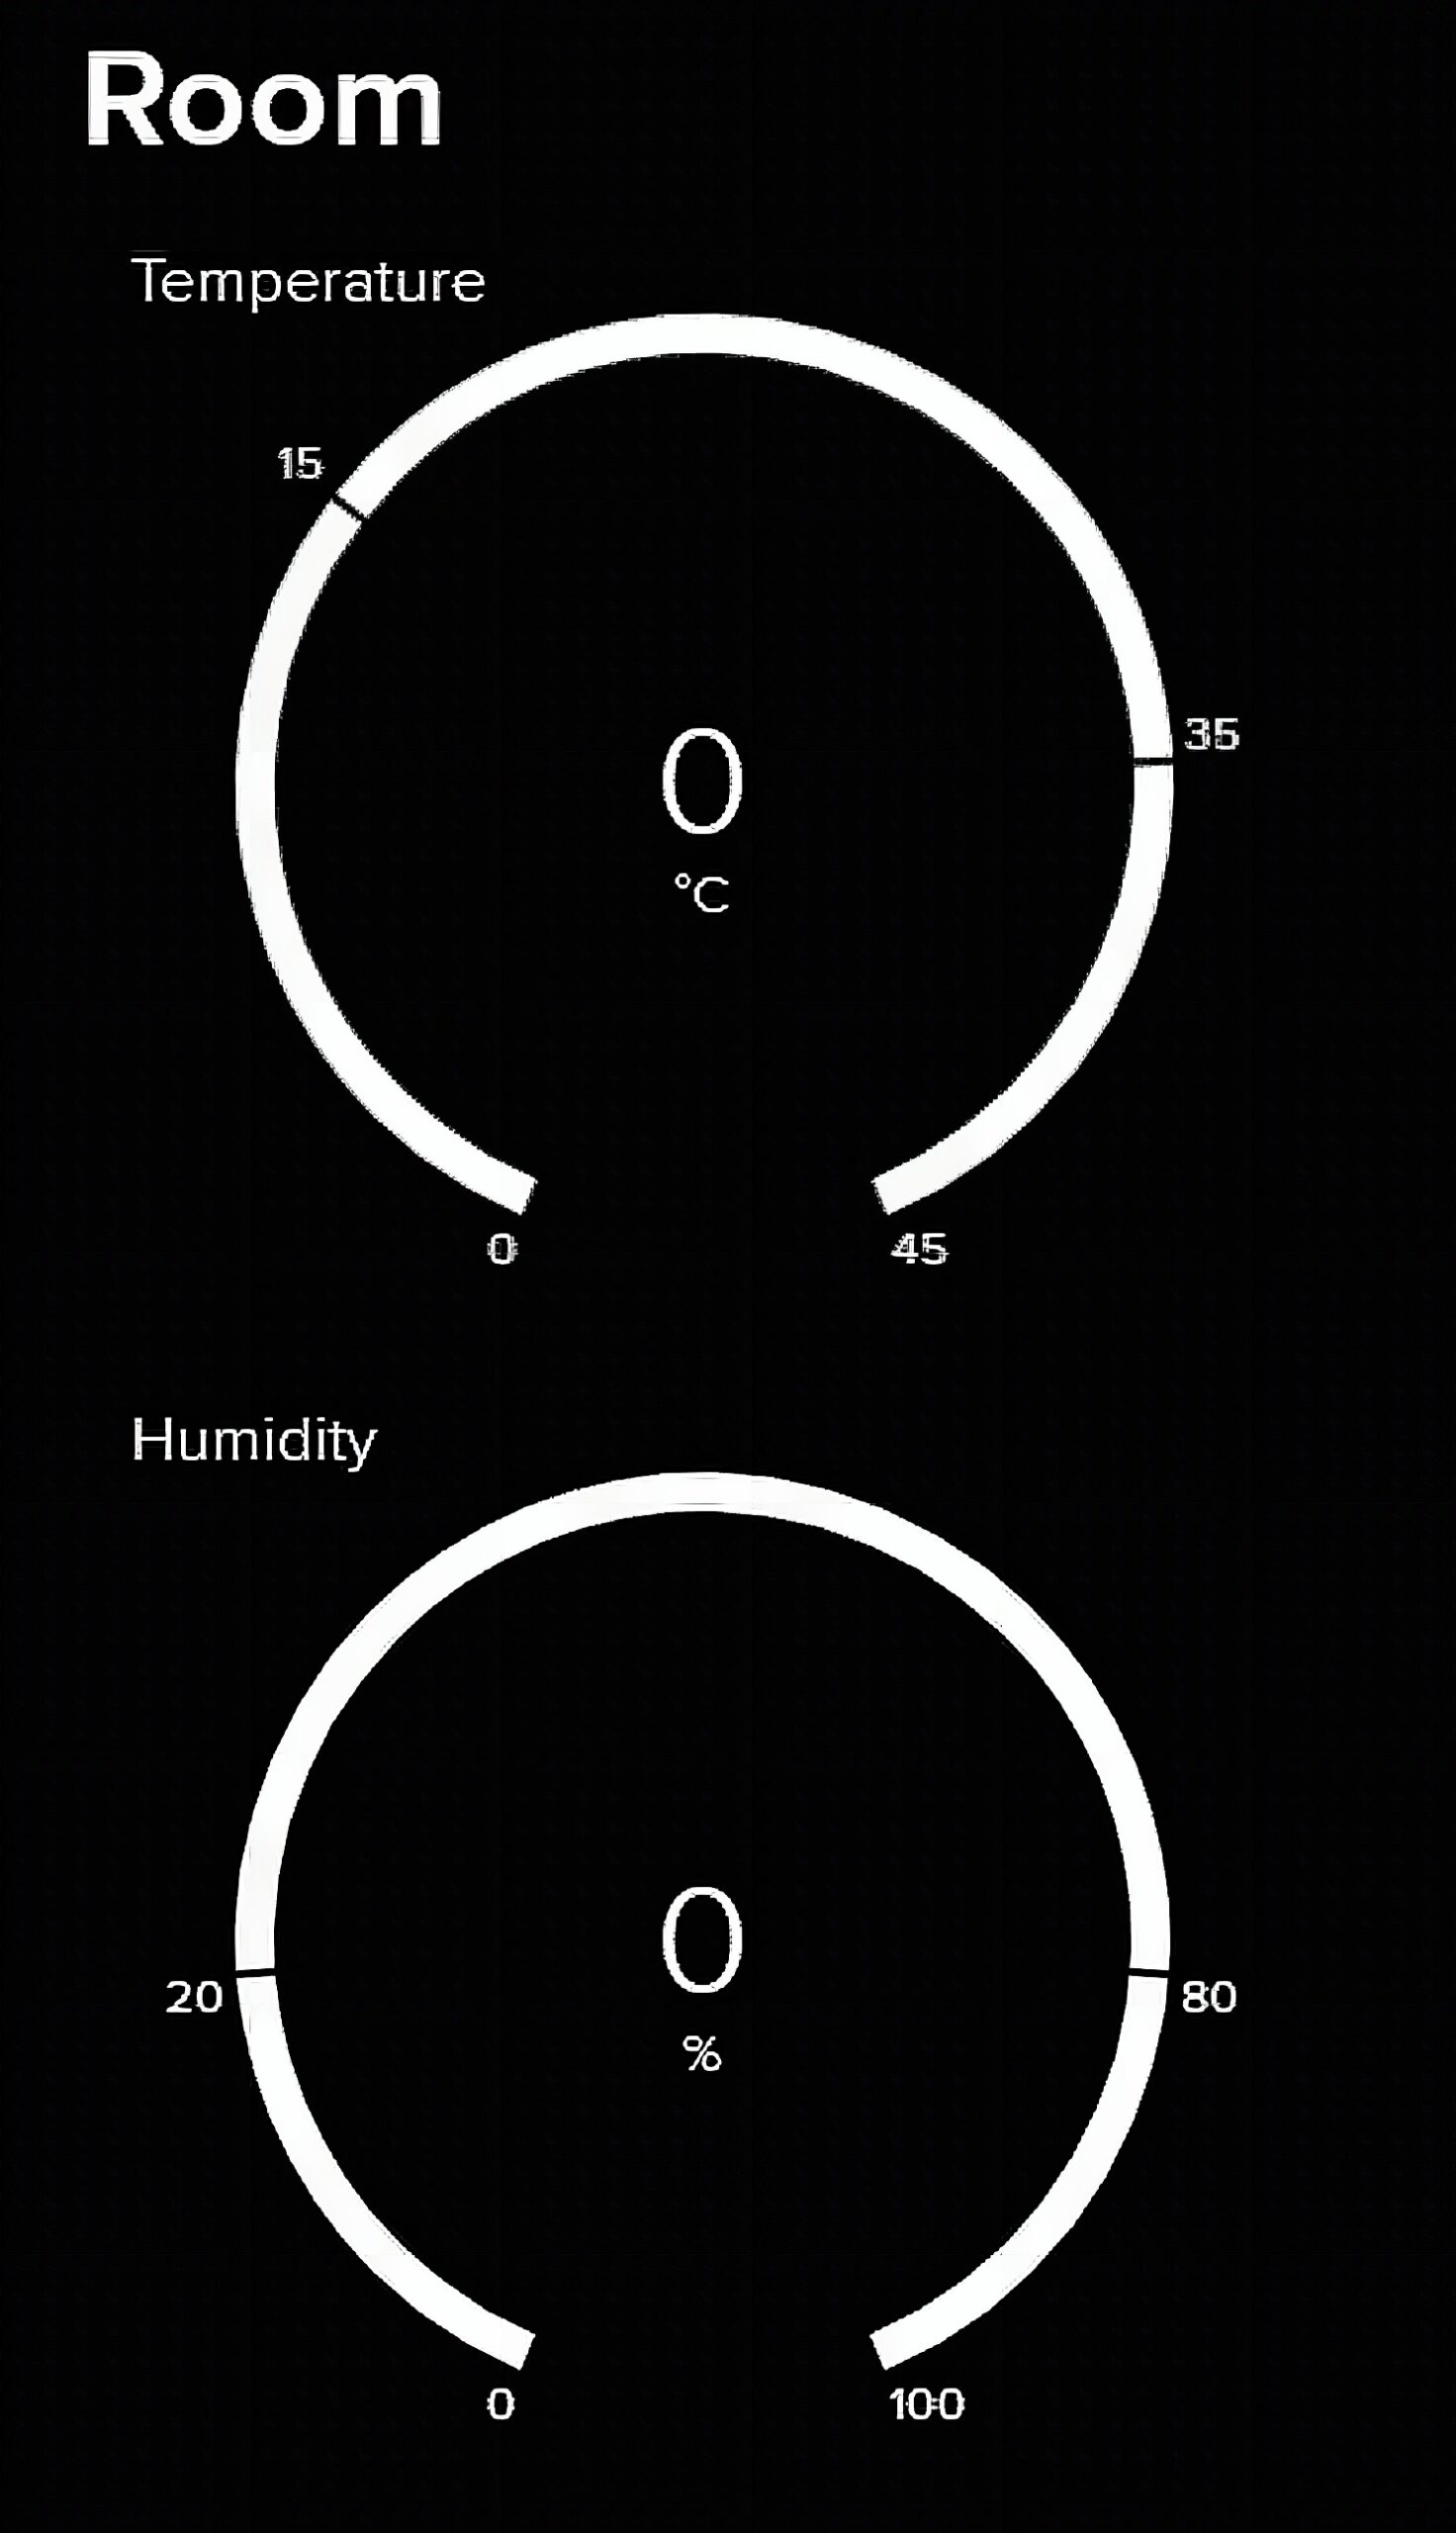
Do the same with Humidity so that you can monitor both data simultaneously.
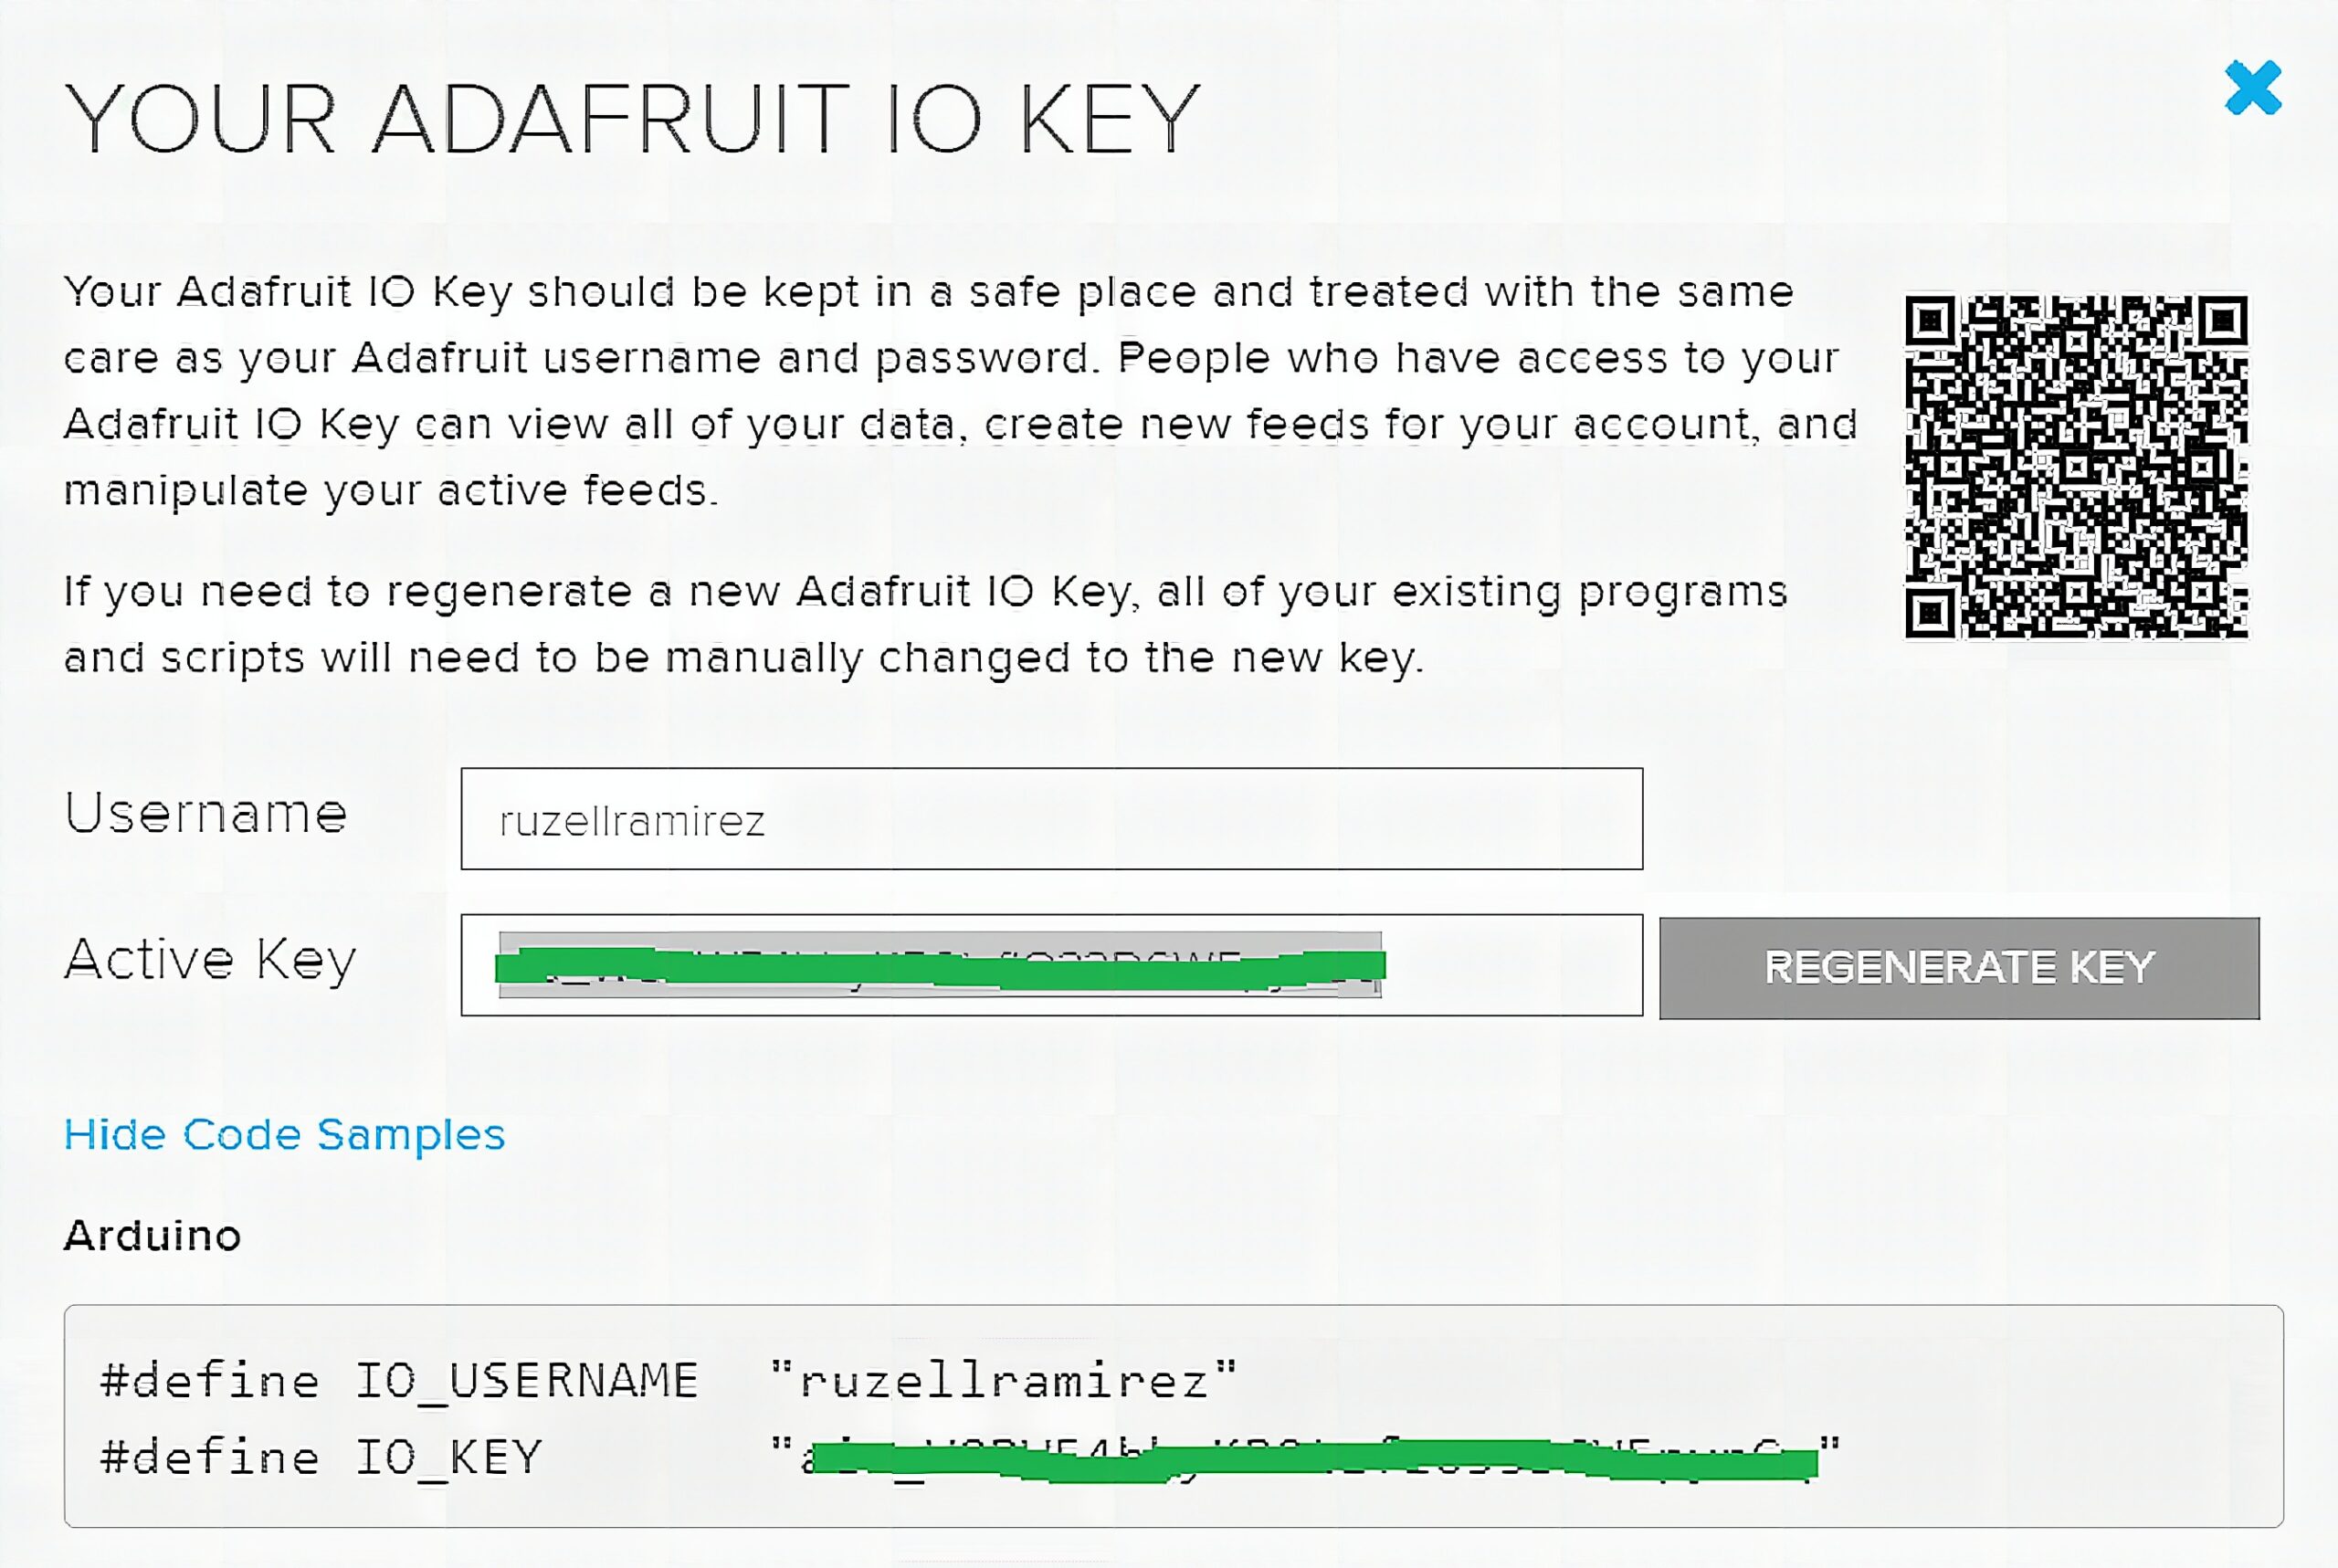
To fill the blocks with data, you need your personal username and key. To obtain both information, go back to the homepage and press Adafruit IO key. A window will appear that displays your username and key. Grab a pen and paper and write them down.
Preparing the Hardware
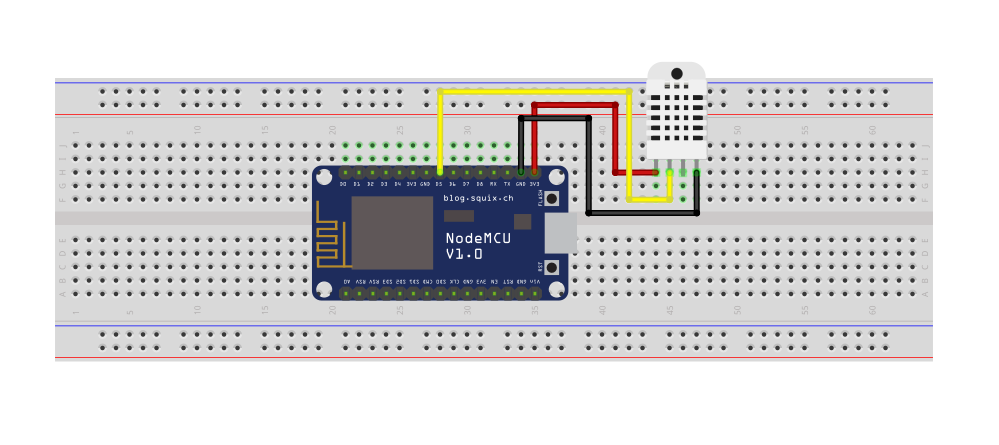
Connect the NodeMCU and the DHT22 sensor as shown below.
Code
Copy this sketch to your Arduino IDE.
#include <ESP8266WiFi.h>
#include "AdafruitIO_WiFi.h"
#include <DHT.h> #define DHTPin D5
#define DHTType DHT22
DHT dht(DHTPin, DHTType); #define WIFI_SSID "WiFi Name"
#define WIFI_PASS "WiFi Password" #define IO_USERNAME "your username"
#define IO_KEY "your key" AdafruitIO_WiFi io(IO_USERNAME, IO_KEY, WIFI_SSID, WIFI_PASS); AdafruitIO_Feed *temperatureFeed = io.feed("Temperature");
AdafruitIO_Feed *humidityFeed = io.feed("MHumidity"); void setup() { Serial.begin(115200); io.connect(); dht.begin(); while(io.status() < AIO_CONNECTED) { Serial.print("."); delay(500); }
} void loop() { io.run(); float t = dht.readTemperature(); float h = dht.readHumidity(); temperatureFeed->save(t); delay(100); humidityFeed->save(h); delay(5000);
}
Code Explanation
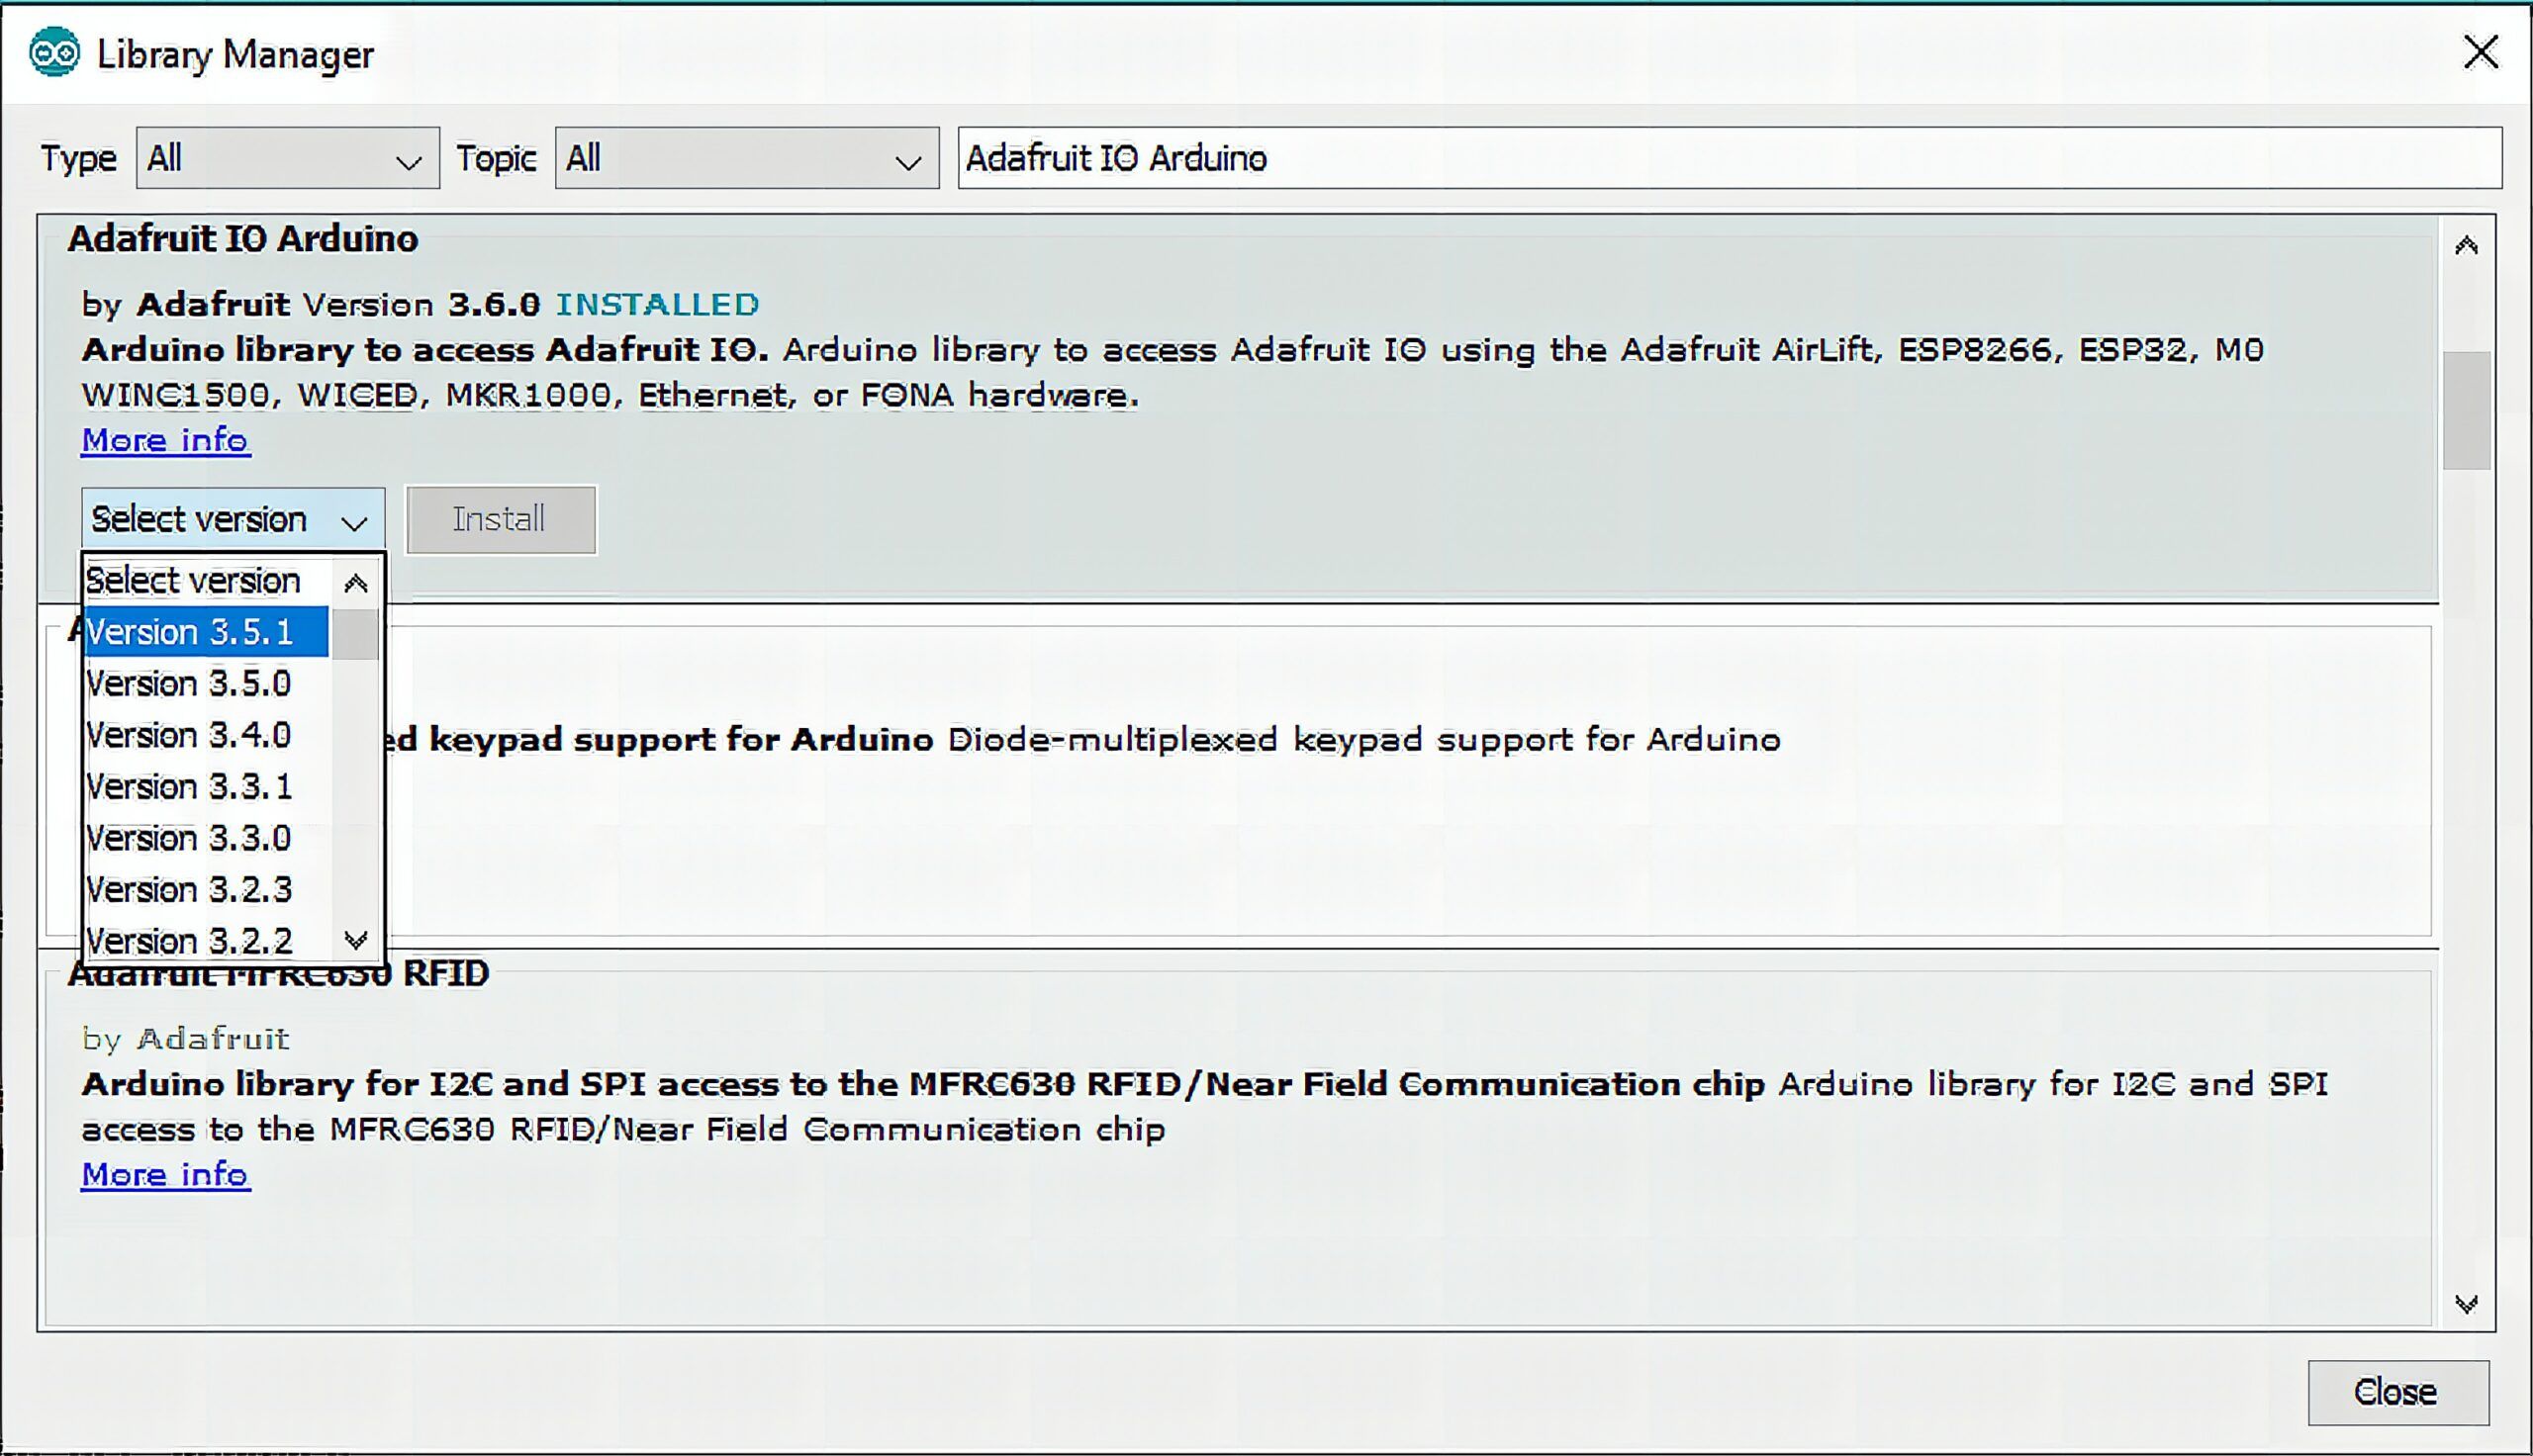
First, install the necessary libraries to use Adafruit IO. Go to Library Manager and search for Adafruit IO Arduino. Select the latest version and press install. This is going to prompt you to install other libraries that Adafruit IO Arduino needs to work properly. Make sure to update your ESP8266 board library to the latest version as well. Older versions of the board give errors when uploading the code.
Create an instance to work with the DHT sensor.
#define DHTPin D5
#define DHTType DHT22
DHT dht(DHTPin, DHTType);
Enter your network credentials here to connect to the internet.
#define WIFI_SSID "WiFi Name"
#define WIFI_PASS "WiFi Password"
Enter your personal username and key here.
#define IO_USERNAME "your username"
#define IO_KEY "your key"
Connects you to WiFi and the Adafruit IO server.
AdafruitIO_WiFi io(IO_USERNAME, IO_KEY, WIFI_SSID, WIFI_PASS);Creates a feed object that allows you to send to the feeds you’ve created in Adafruit IO.
AdafruitIO_Feed *temperatureFeed = io.feed("Temperature");
AdafruitIO_Feed *humidityFeed = io.feed("Humidity");
Connects to Adafruit IO.
io.connect();Initiates your DHT sensor.
dht.begin();In the loop section, we read first the temperature and humidity values from the DHT22 sensor. Store it to float t and h, then send it to the feed object via save(). Then, to prevent the dashboard from overflowing, we limit the data points every 5 seconds using the delay function.
void loop() { io.run(); float t = dht.readTemperature(); float h = dht.readHumidity(); temperatureFeed->save(t); humidityFeed->save(h); delay(5000);
}
Demonstration
Finally, upload the sketch to NodeMCU. You can add serial indicators to check if the values that are sent to Adafruit IO are correct.
Frequently Asked Questions
What does this Creating an Adafruit IO dashboard using ESP8266 tutorial cover?
Gone are the days of plain data visualization! In this tutorial, we are going to create a temperature and humidity Adafruit IO dashboard using NodeMCU.
Why won't my ESP8266 connect to home Wi-Fi?
ESP8266 only supports 2.4GHz. If your router is on 5GHz only, switch the SSID to a 2.4GHz band. Also check WPA2 (not WPA3) and that the SSID is broadcasting.
Should I use ESP8266 or ESP32 for the Creating an Adafruit IO dashboard using ESP8266 build?
ESP8266 (NodeMCU/Wemos D1) is cheaper and fine for one Wi-Fi sensor + one I/O. ESP32 gives BLE, more GPIO, dual core, touch pins — pick it for richer projects.