

Visualize your data easily with a veteran in the engineering industry – National Instrument’s LabVIEW! It is a perfect solution to every makers’ test, measurement, and control needs.
Introduction
LabVIEW is a staple tool in testing and controlling sytems. That was established to me even in my early days in the university. It provides a user-friendly graphical approach in programming as well as it provides quick visualization into data but I never knew it can interact with Arduino and Raspberry Pi as well.
In this post, I’ll discuss some LabVIEW essentials, Makerhub LINX, and a sample project using an Arduino UNO.
LabVIEW
Overview
According to their website, LabVIEW is a systems engineering software for applications that require test, measurement, and control with rapid access to hardware and data insights.
It offers a graphical programming approach that helps you visualize every aspect of your application, including hardware configuration, measurement data, and debugging. This visualization makes it simple to integrate measurement hardware from any vendor, represent complex logic on the diagram, develop data analysis algorithms, and design custom engineering user interfaces.
Okay, so how does it work?
Getting Started
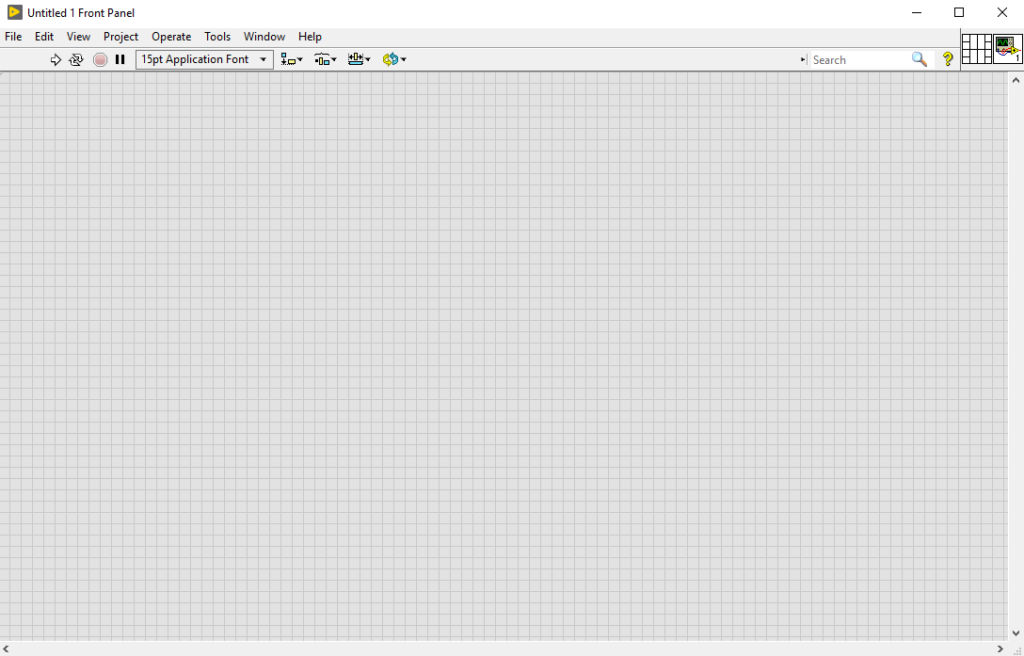
First of all, there are two environments in LabVIEW that you can work on – Front Panel and Block Diagram. The Front Panel appears immediately when you start a new project. Basically, this is where the UIs (user interfaces) appear when you run the program. By right clicking, you can open the controls palette to add controls and indicators. More on that later.
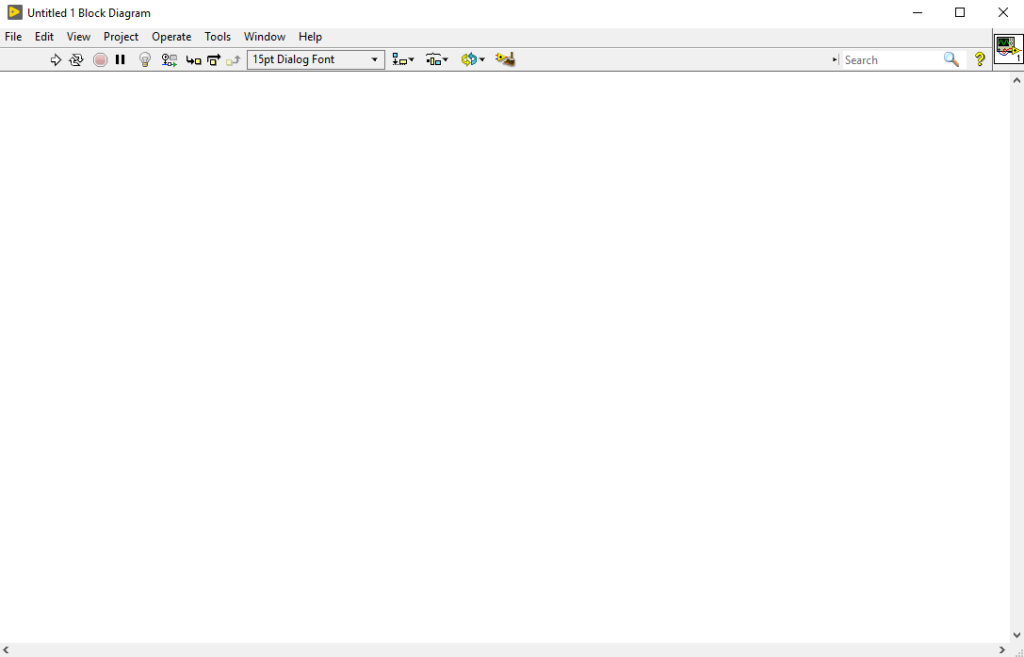
On the other hand, the Block Diagram is where we create the visual program. One of LabVIEW’s best features is that you can literally create a program with just icons and wires. You can open it by pressing CTRL + E.
The Functions Palette provides for loops, while loops, data types, mathematical operations, and many more. Let us discover how in the next section.
Controls and Functions Palettes
Controls Palette
Let us start with the Controls Palette. I’ll right click on the front panel to bring out the toolbox.
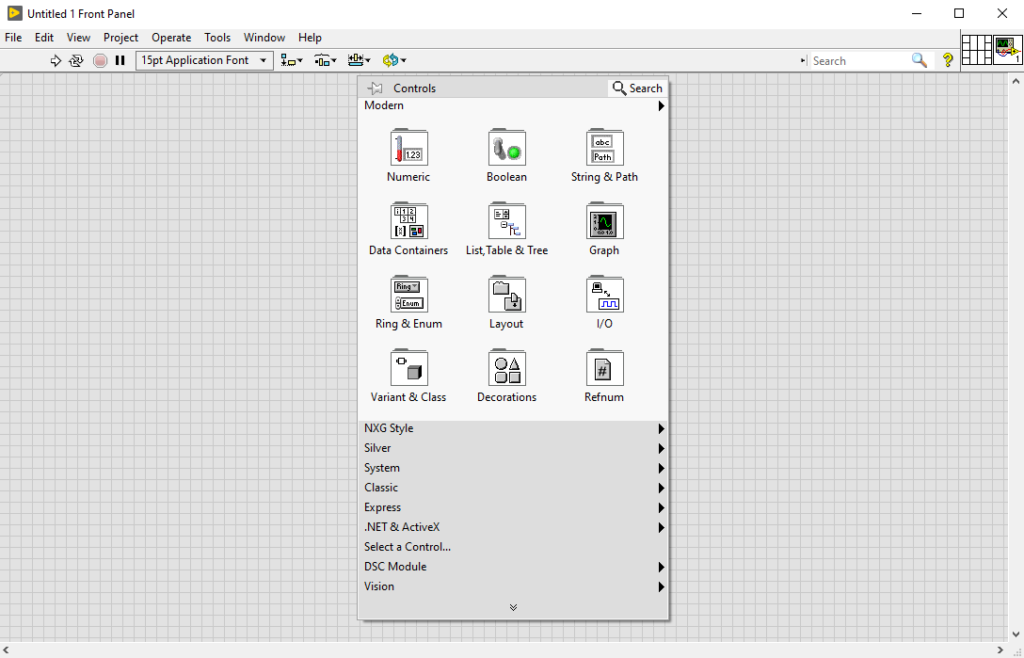
You will see a wide selection of controls and indicators. Basically, controls are user inputs while indicators are outputs. Let us see how this work. (Tip: You can pin the controls palette on your front panel so you won’t have to bring it up every time. The pin is located in the upper left corner of the toolbox.)
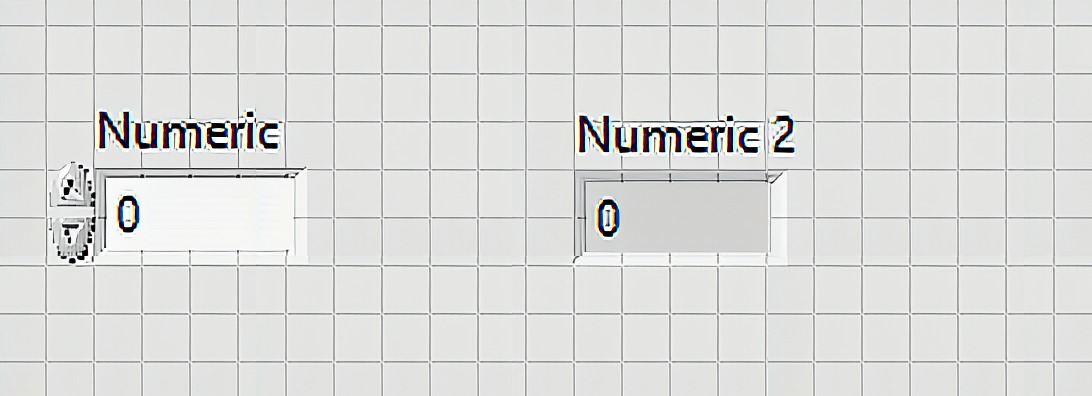
On the modern category, click on Numeric.
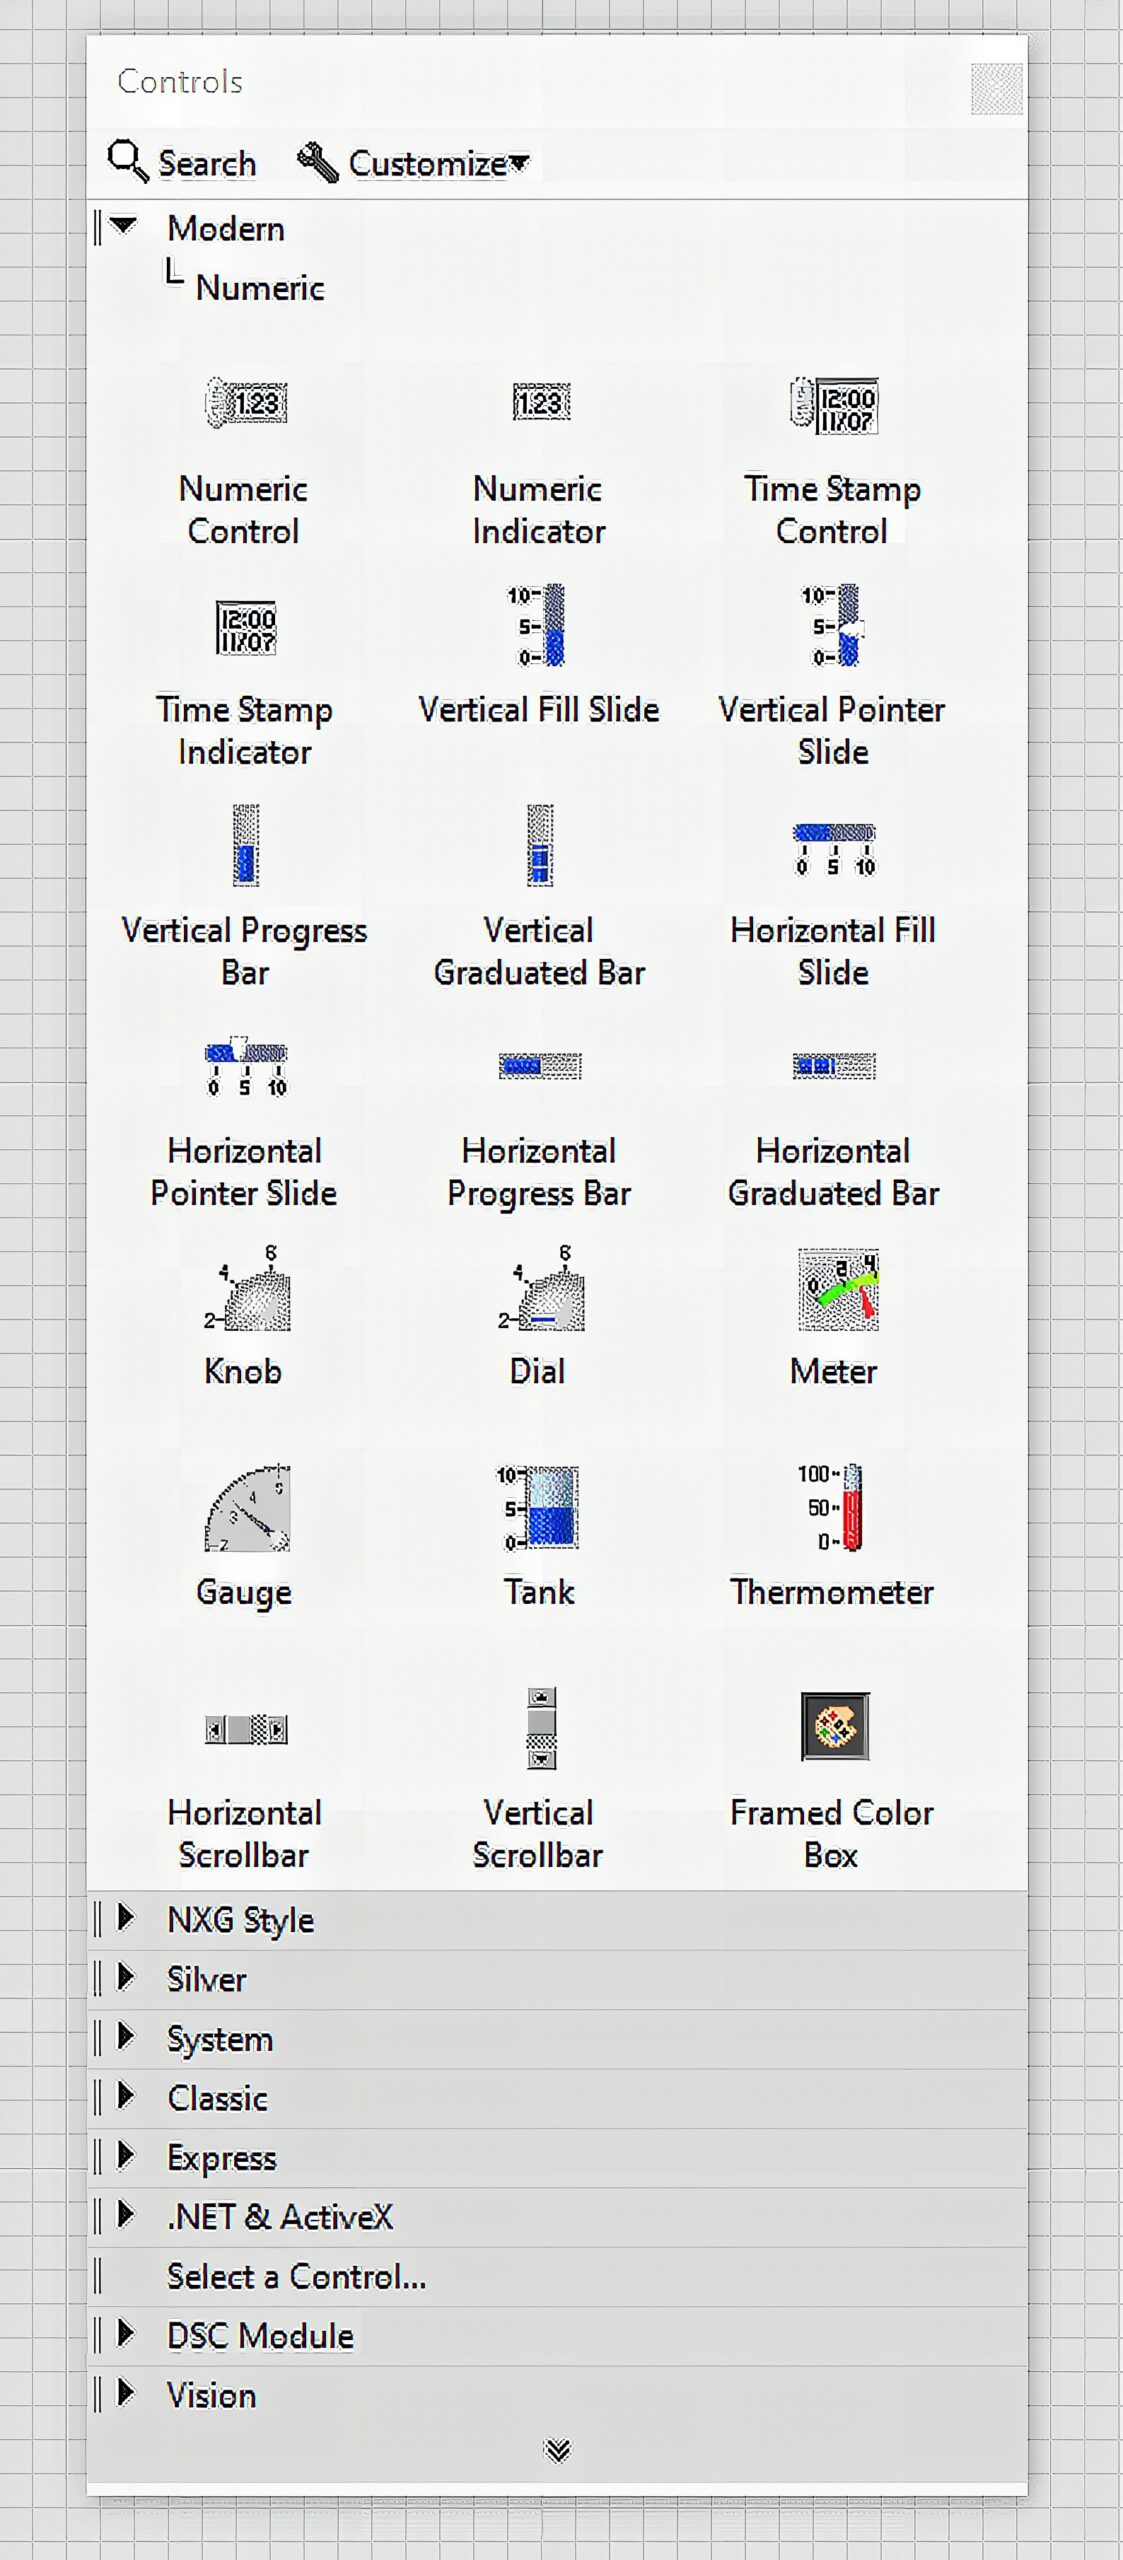
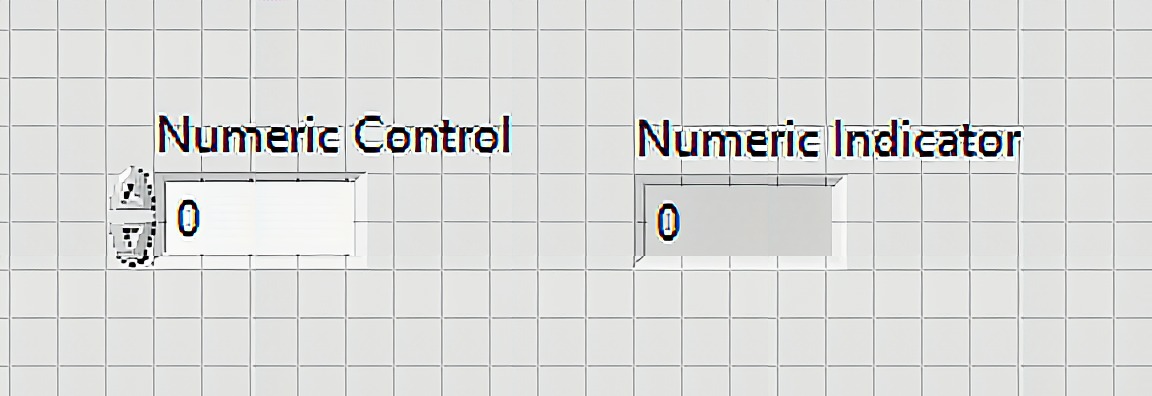
As you can see, these are UIs where you can show user input data (control) or visualize the output (indicator). LabVIEW provides a vast amount of these two to help you visualize your data for different kinds of projects. They are categorized by their style or function. No need to worry as most of them are self explanatory. Also, you can find the perfect control and indicator for your project by using the search box in the upper right corner of the toolbox. For now, let’s add Numeric Control and Numeric Indicator
You can rename them by double clicking their labels. I’ll name them like their names in the toolbox so you can easily follow.
So how can we use this? Turns out to actually make the user interfaces in the front panel work, we’ll need to program it in the block diagram first. Let us bring out the block diagram to understand this.
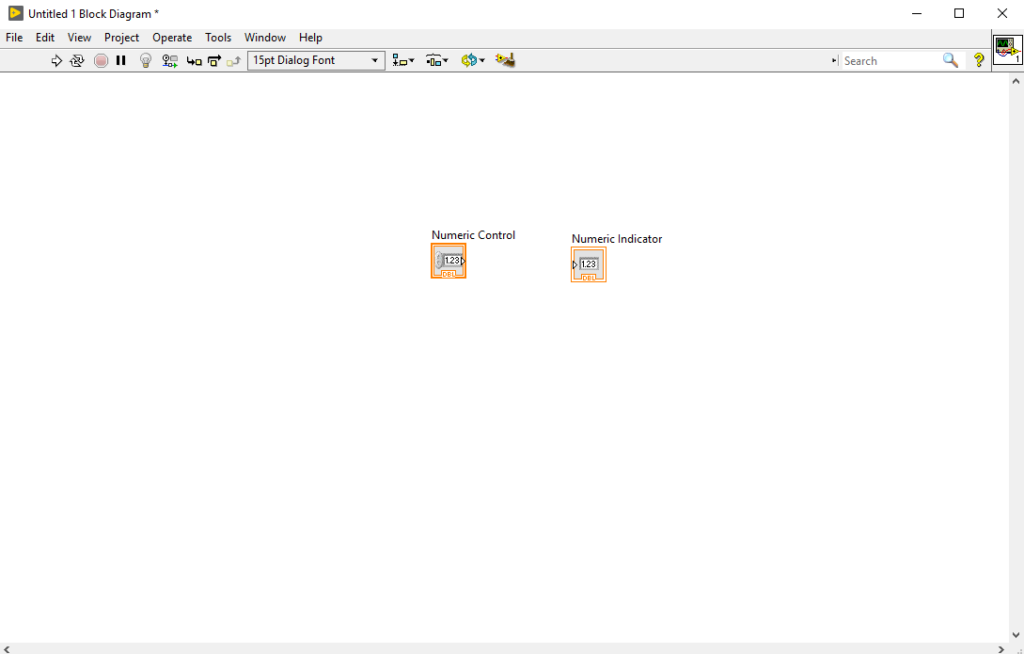
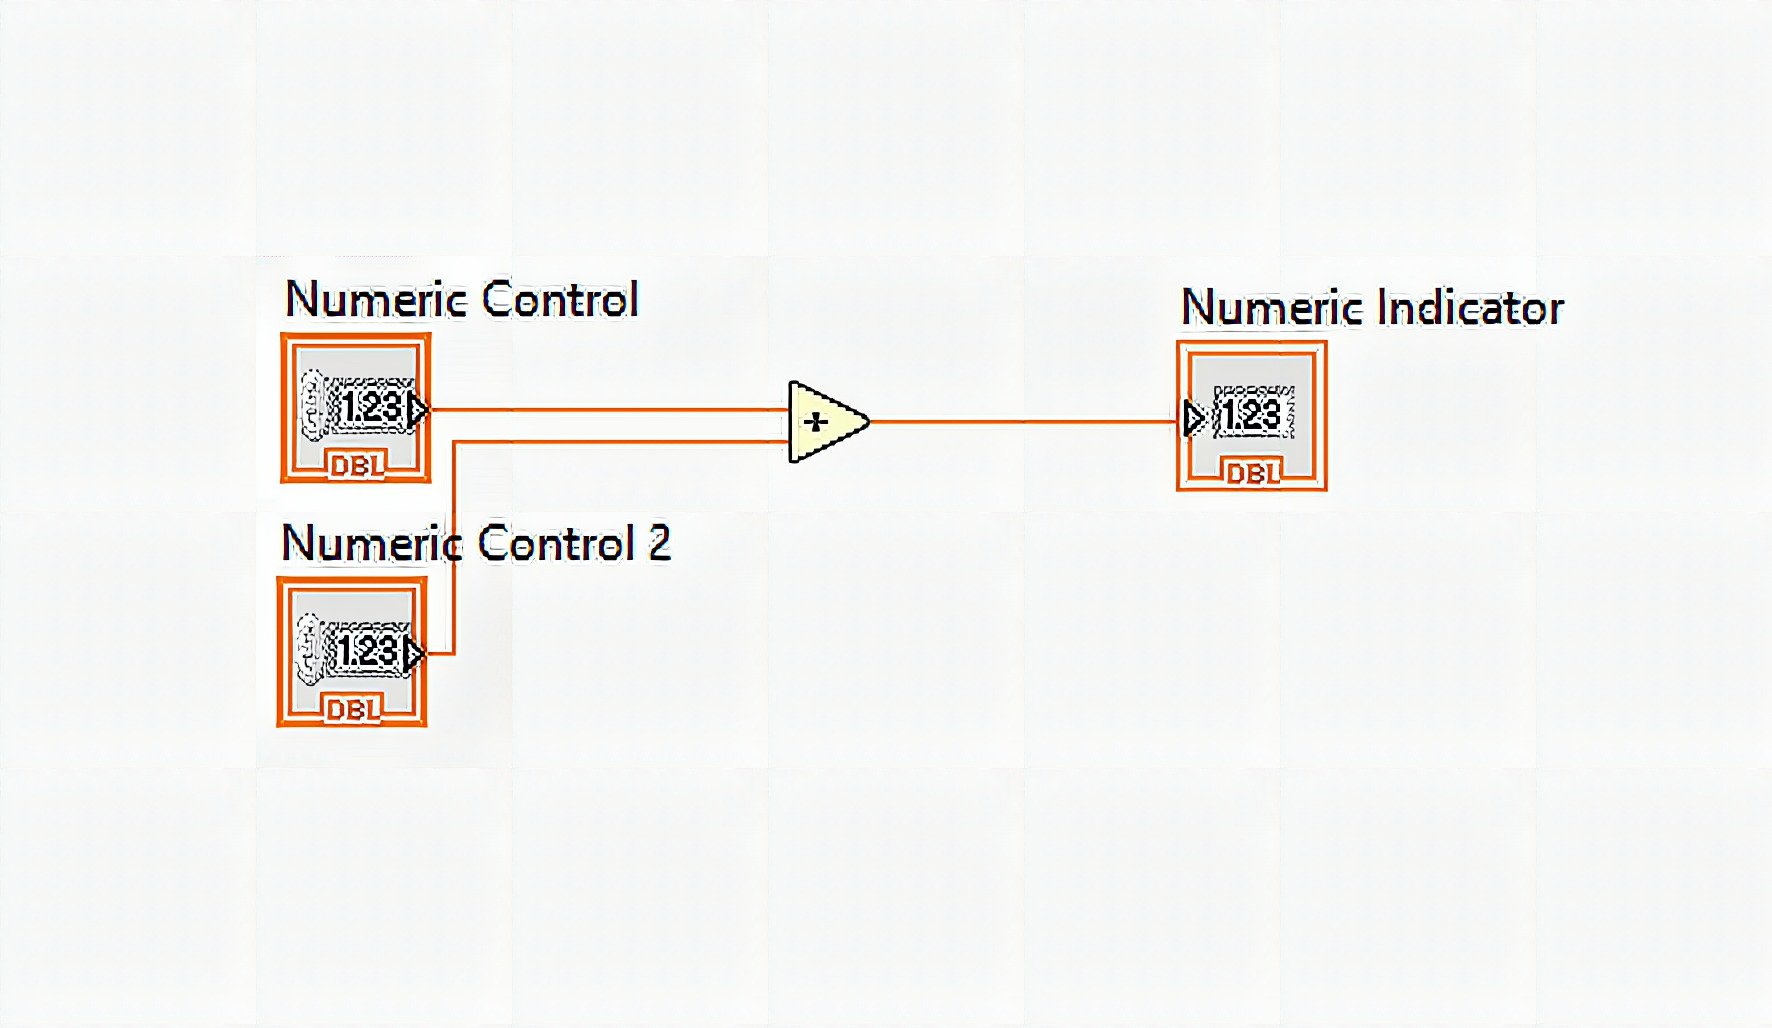
As you can see, the two icons on the front panel are here. We’ll need to connect them with wires to make them work. Moreover, let’s spice things up by using the functions palette. I’ll right click on the block diagram to include an add function. I’ll also add another numeric control for the sake of demonstration.
Functions Palette
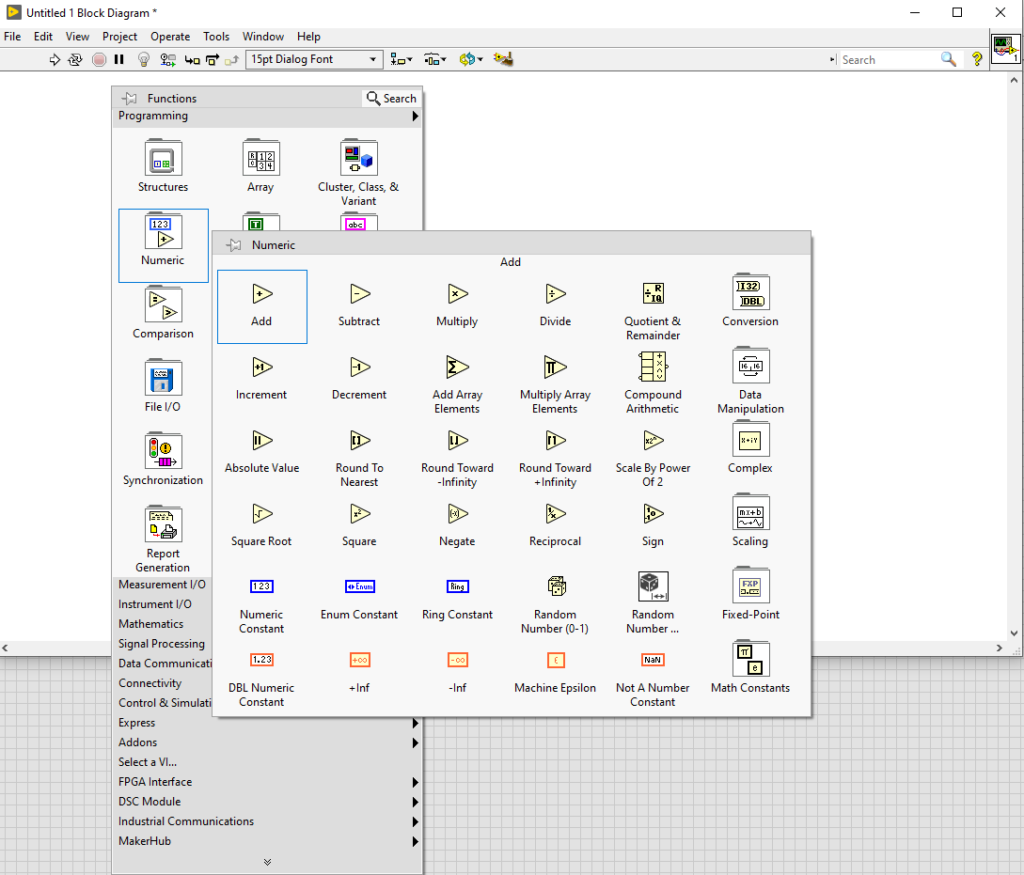
You can set the two environments to both appear on your screen by pressing Ctrl + T. You can also click on Window and from there, choose Tile down.

We now have the basic requirements to create a program that adds two numbers. Let’s connect them with wires.
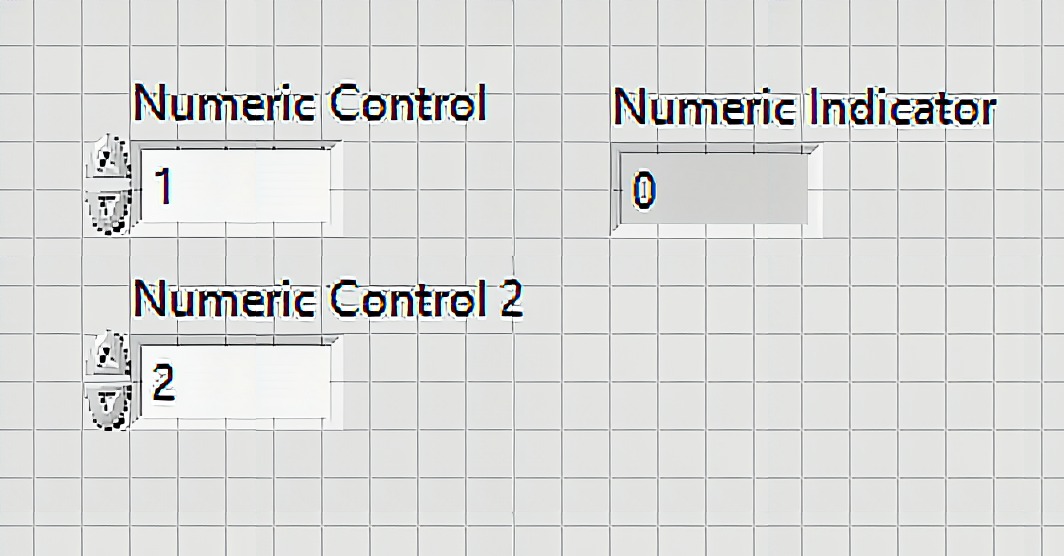
Before I run the program, I’ll adjust the values of the numeric controls to the values I want to add.
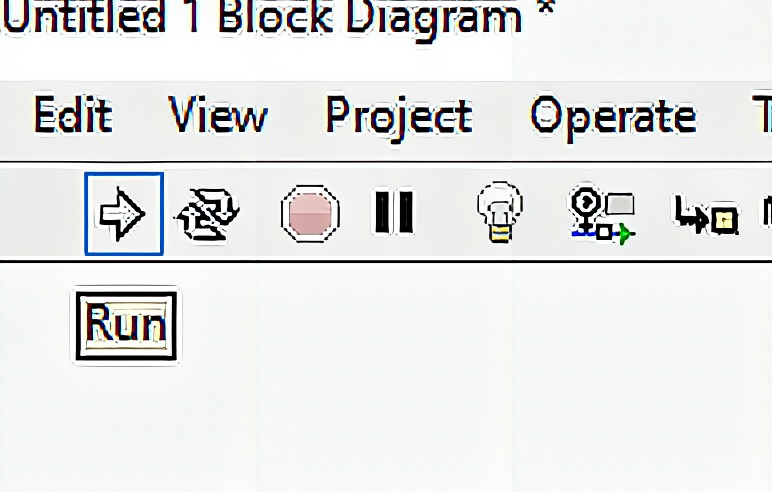
Finally, we can press run!
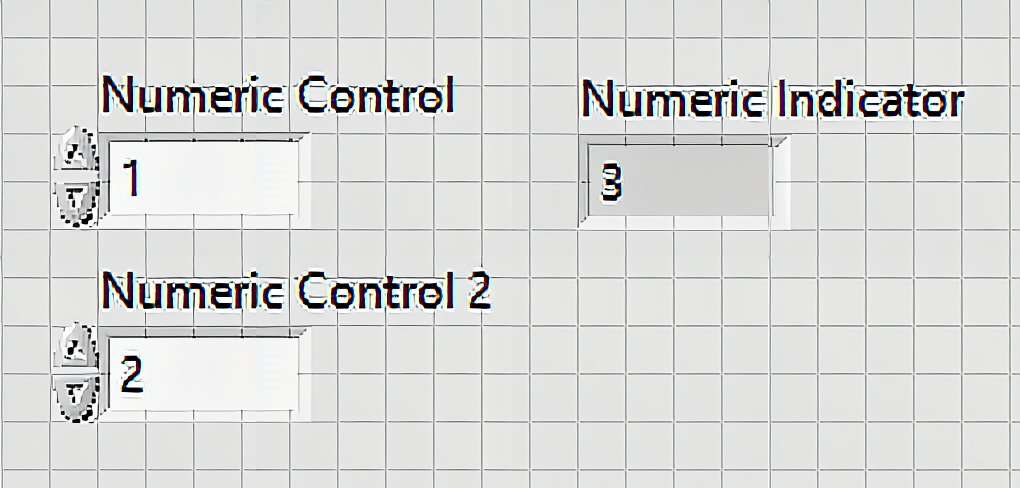
The front panel now shows the expected value.
That’s how LabVIEW works. Simple and straightforward. The software offers a lot more features than this though. I’ll leave them up to you to explore as I’ll focus on how I can use it in my Arduino projects.
Makerhub Linx
Here’s the interesting part. Up until awhile ago, I never knew this module exists in LabVIEW.
LabVIEW Makerhub Linx makes use of LabVIEW’s VIs to interact with common development boards like Arduino, Beaglebone, and Raspberry Pi. This module also has a vast amount of sensor libraries so you can directly access sensor data from the computer. Aside from that, there are peripheral VIs to access your devices digital I/O, analog I/O, SPI, I2C, UART, PWM and more. With this tools, you can now use LabVIEW to program your Arduino and create a user interface for data visualization simultaneously! Talk about hitting two birds with one stone.
You can access sample VIs easily with Find Example in the Help toolbar. Just use linx as a keyword to see the various examples available.
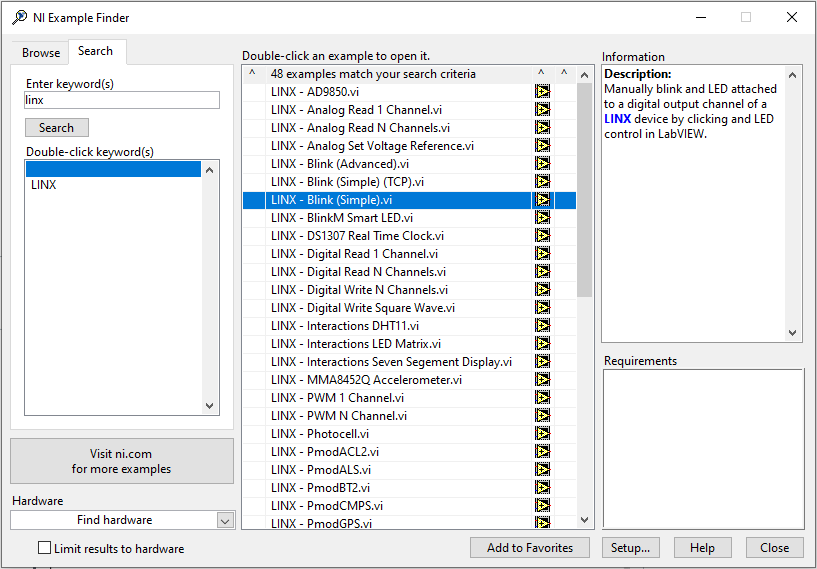
I tried to open the “Hello World” of hardware development, blinking an LED. It brings out a user-friendly VI filled with helpful notes and instructions on how to use it.
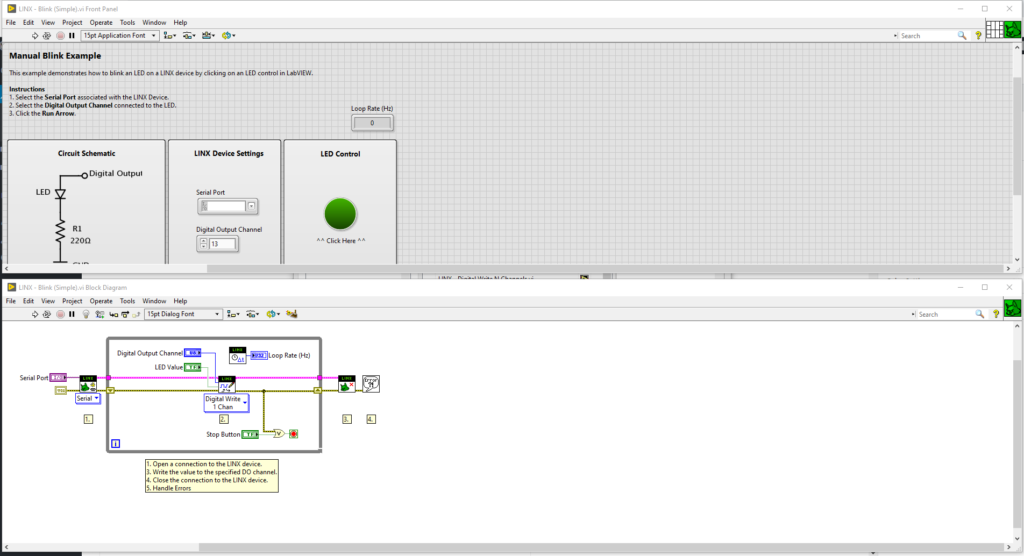
We can use these examples as references or sometimes even a start point for projects. They’re easily modifiable. Just don’t forget to save them as a different file. Next, let us explore Makerhub in the Functions palette.
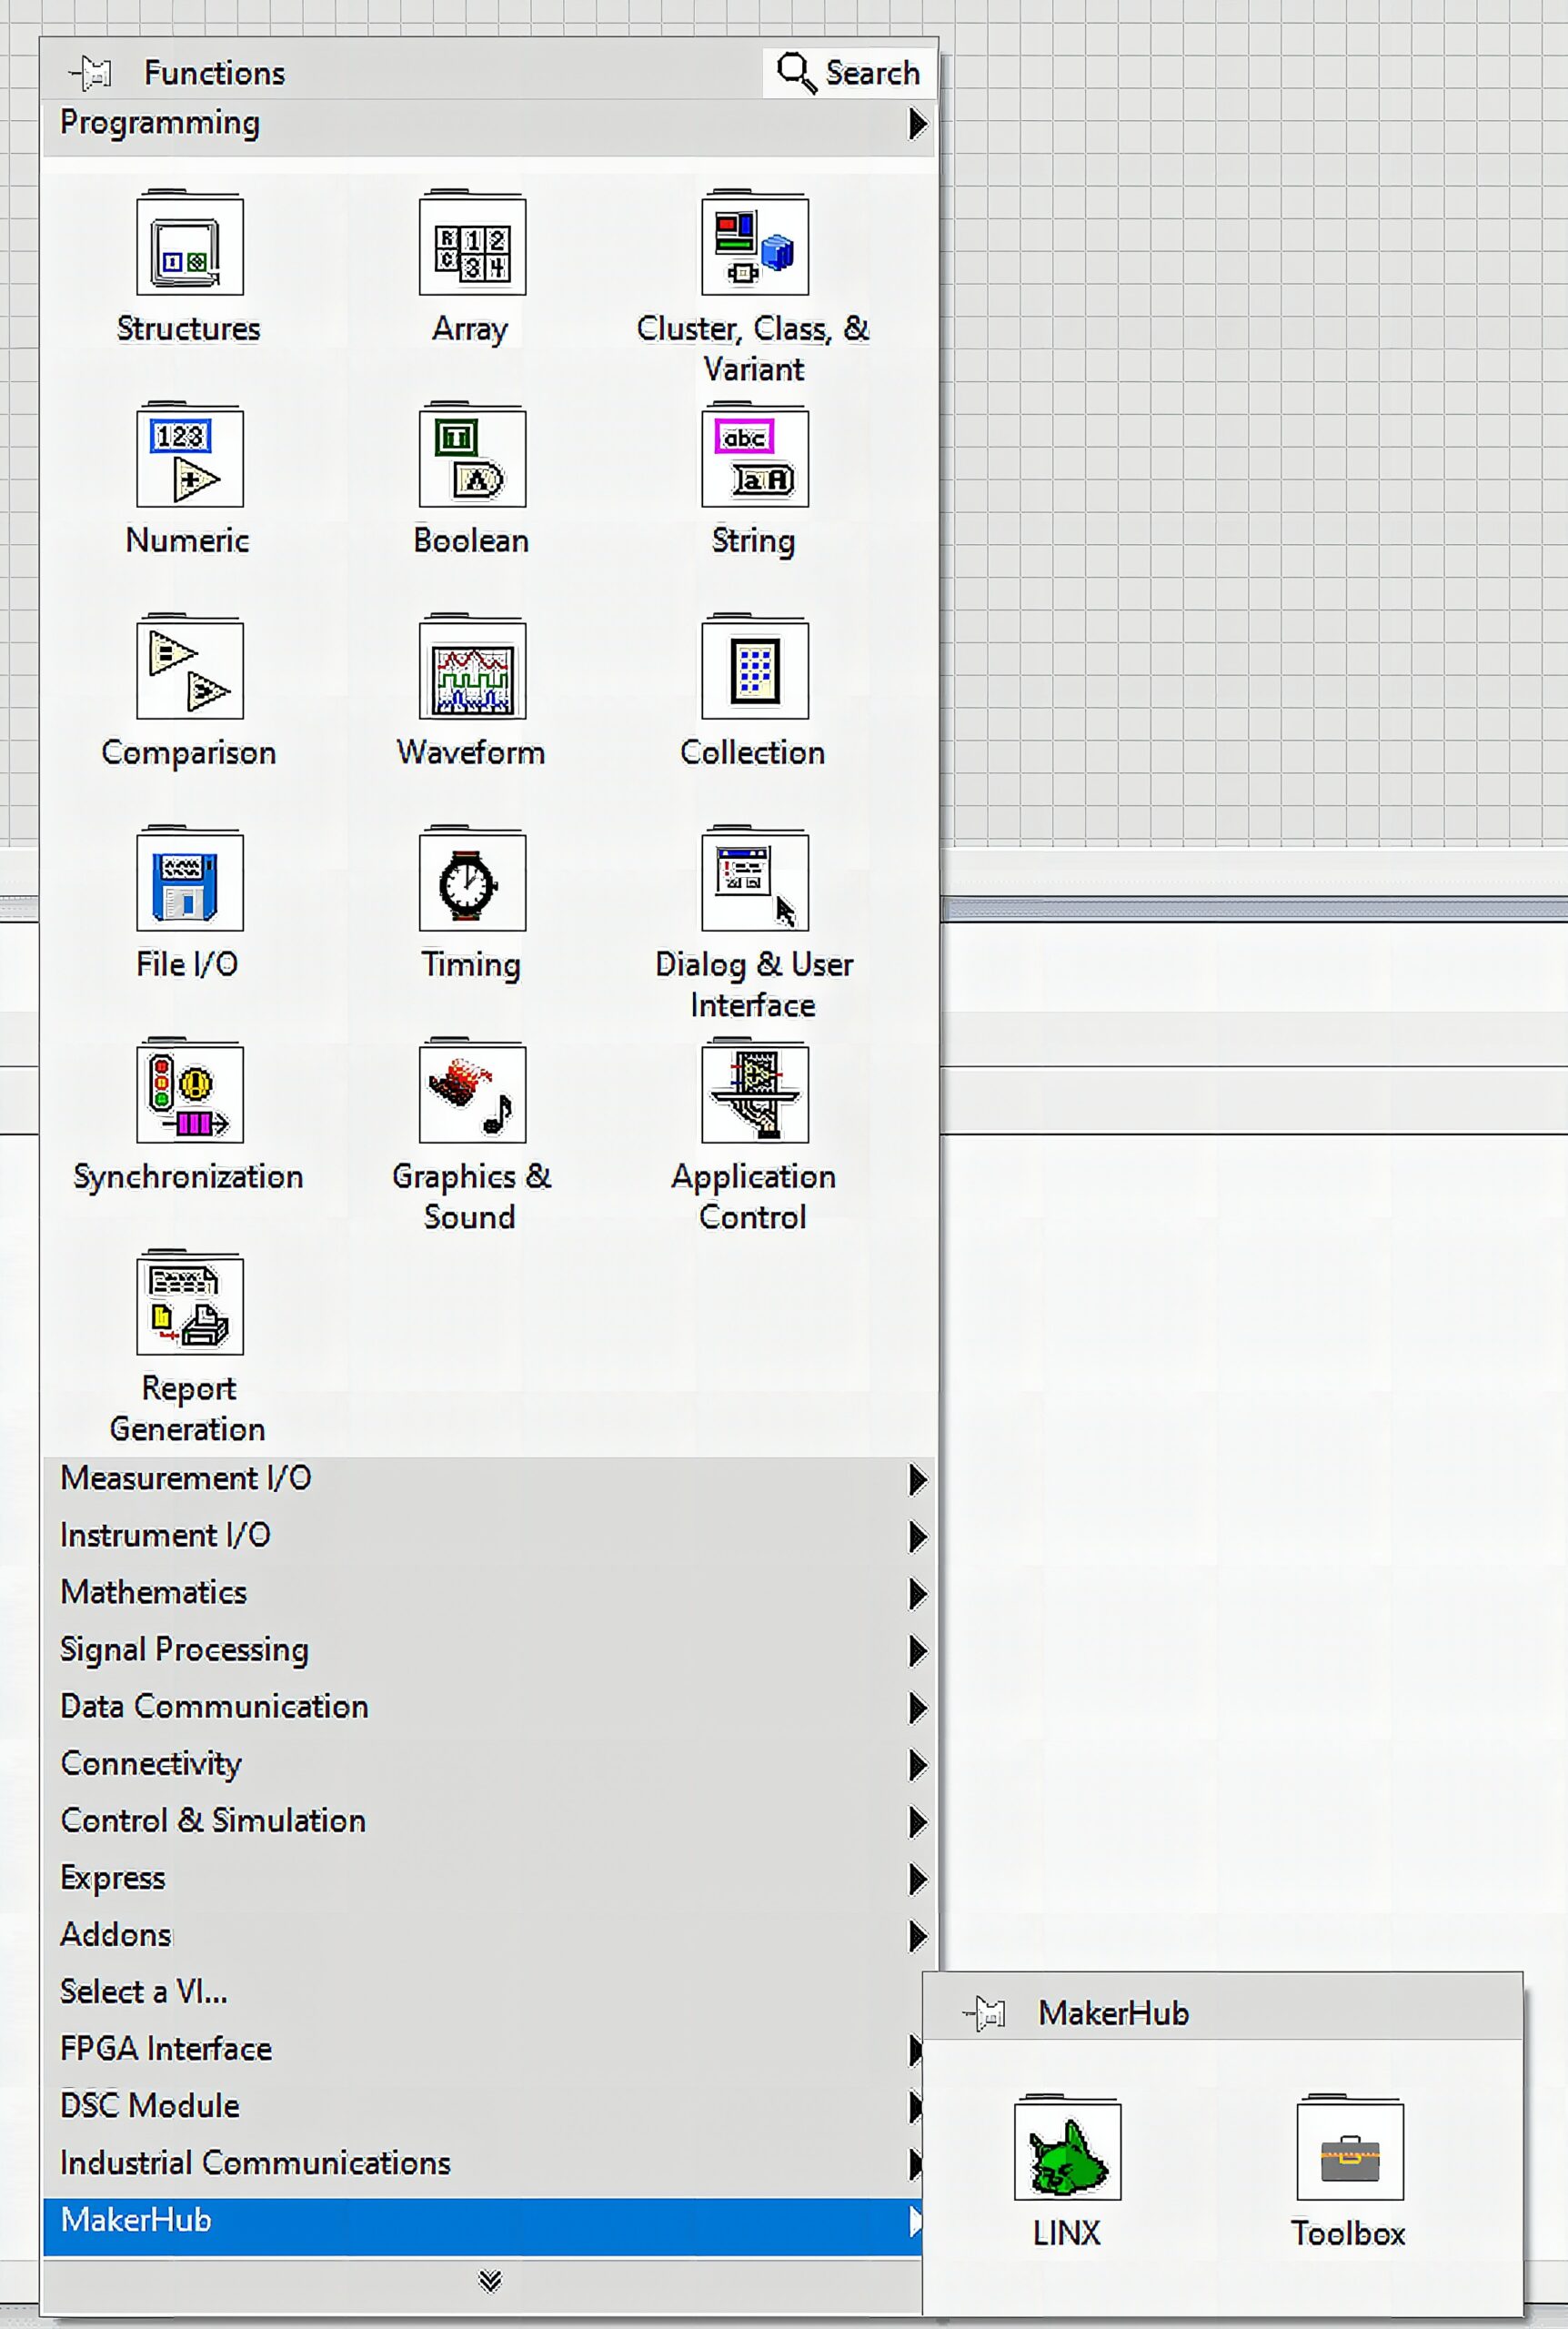
Inside LINX
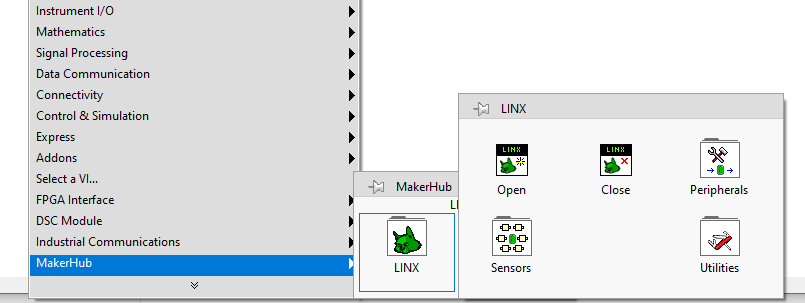
Here we can see the essential functions we can use in interacting with our development boards.
- Open – This marks the starts of the program for your board. This is placed after a serial port function. A serial port function indicates the port location of your development board.
- Close – This marks the end of the program for your board.
- Peripherals – This access your devices digital I/O, analog I/O, SPI, I2C, UART, PWM, and etc.
- Sensors – This provides interaction capabilities with LINX compatible sensors.
- Utilities – This consists of various helpful functions for embedded systems development.
Now that we’re familiar with how Makerhub LINX work, let’s try using it with a sample project.
Sample Arduino Sonar
Hardware
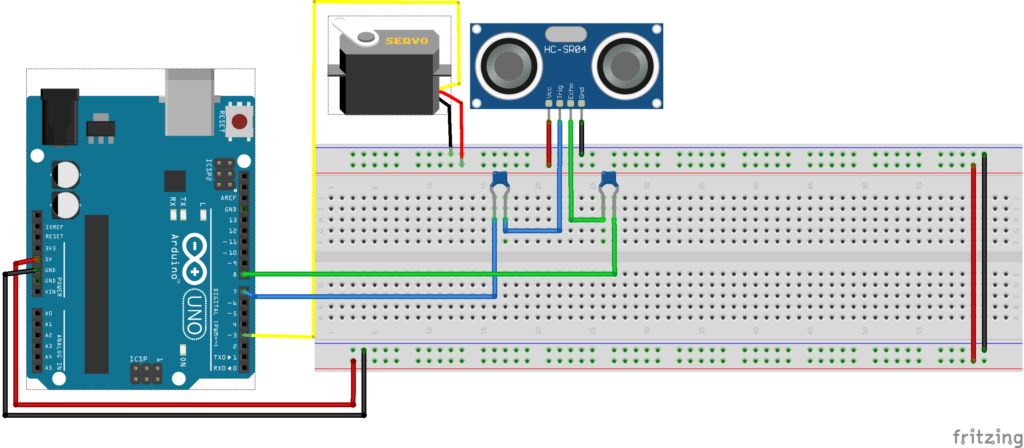
Things you’ll need:
- Arduino UNO
- Any servo Motor
- Ultrasonic Ranging Sensor Bracket
- Any ultrasonic sensor
- Any two non-polarized capacitors (Value between 10pF to 100?F)
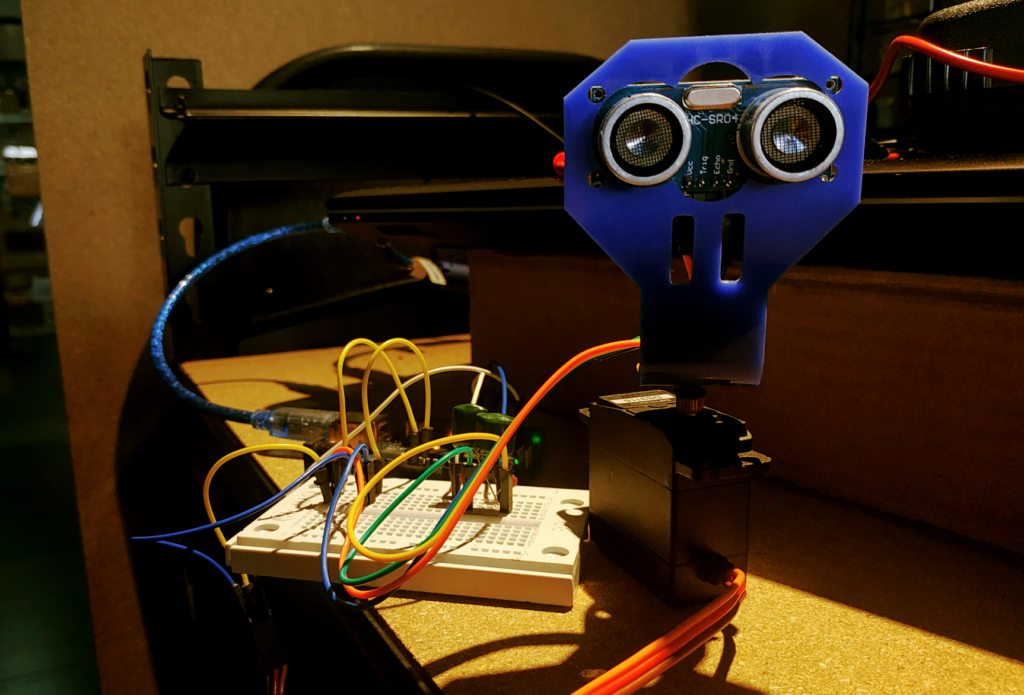
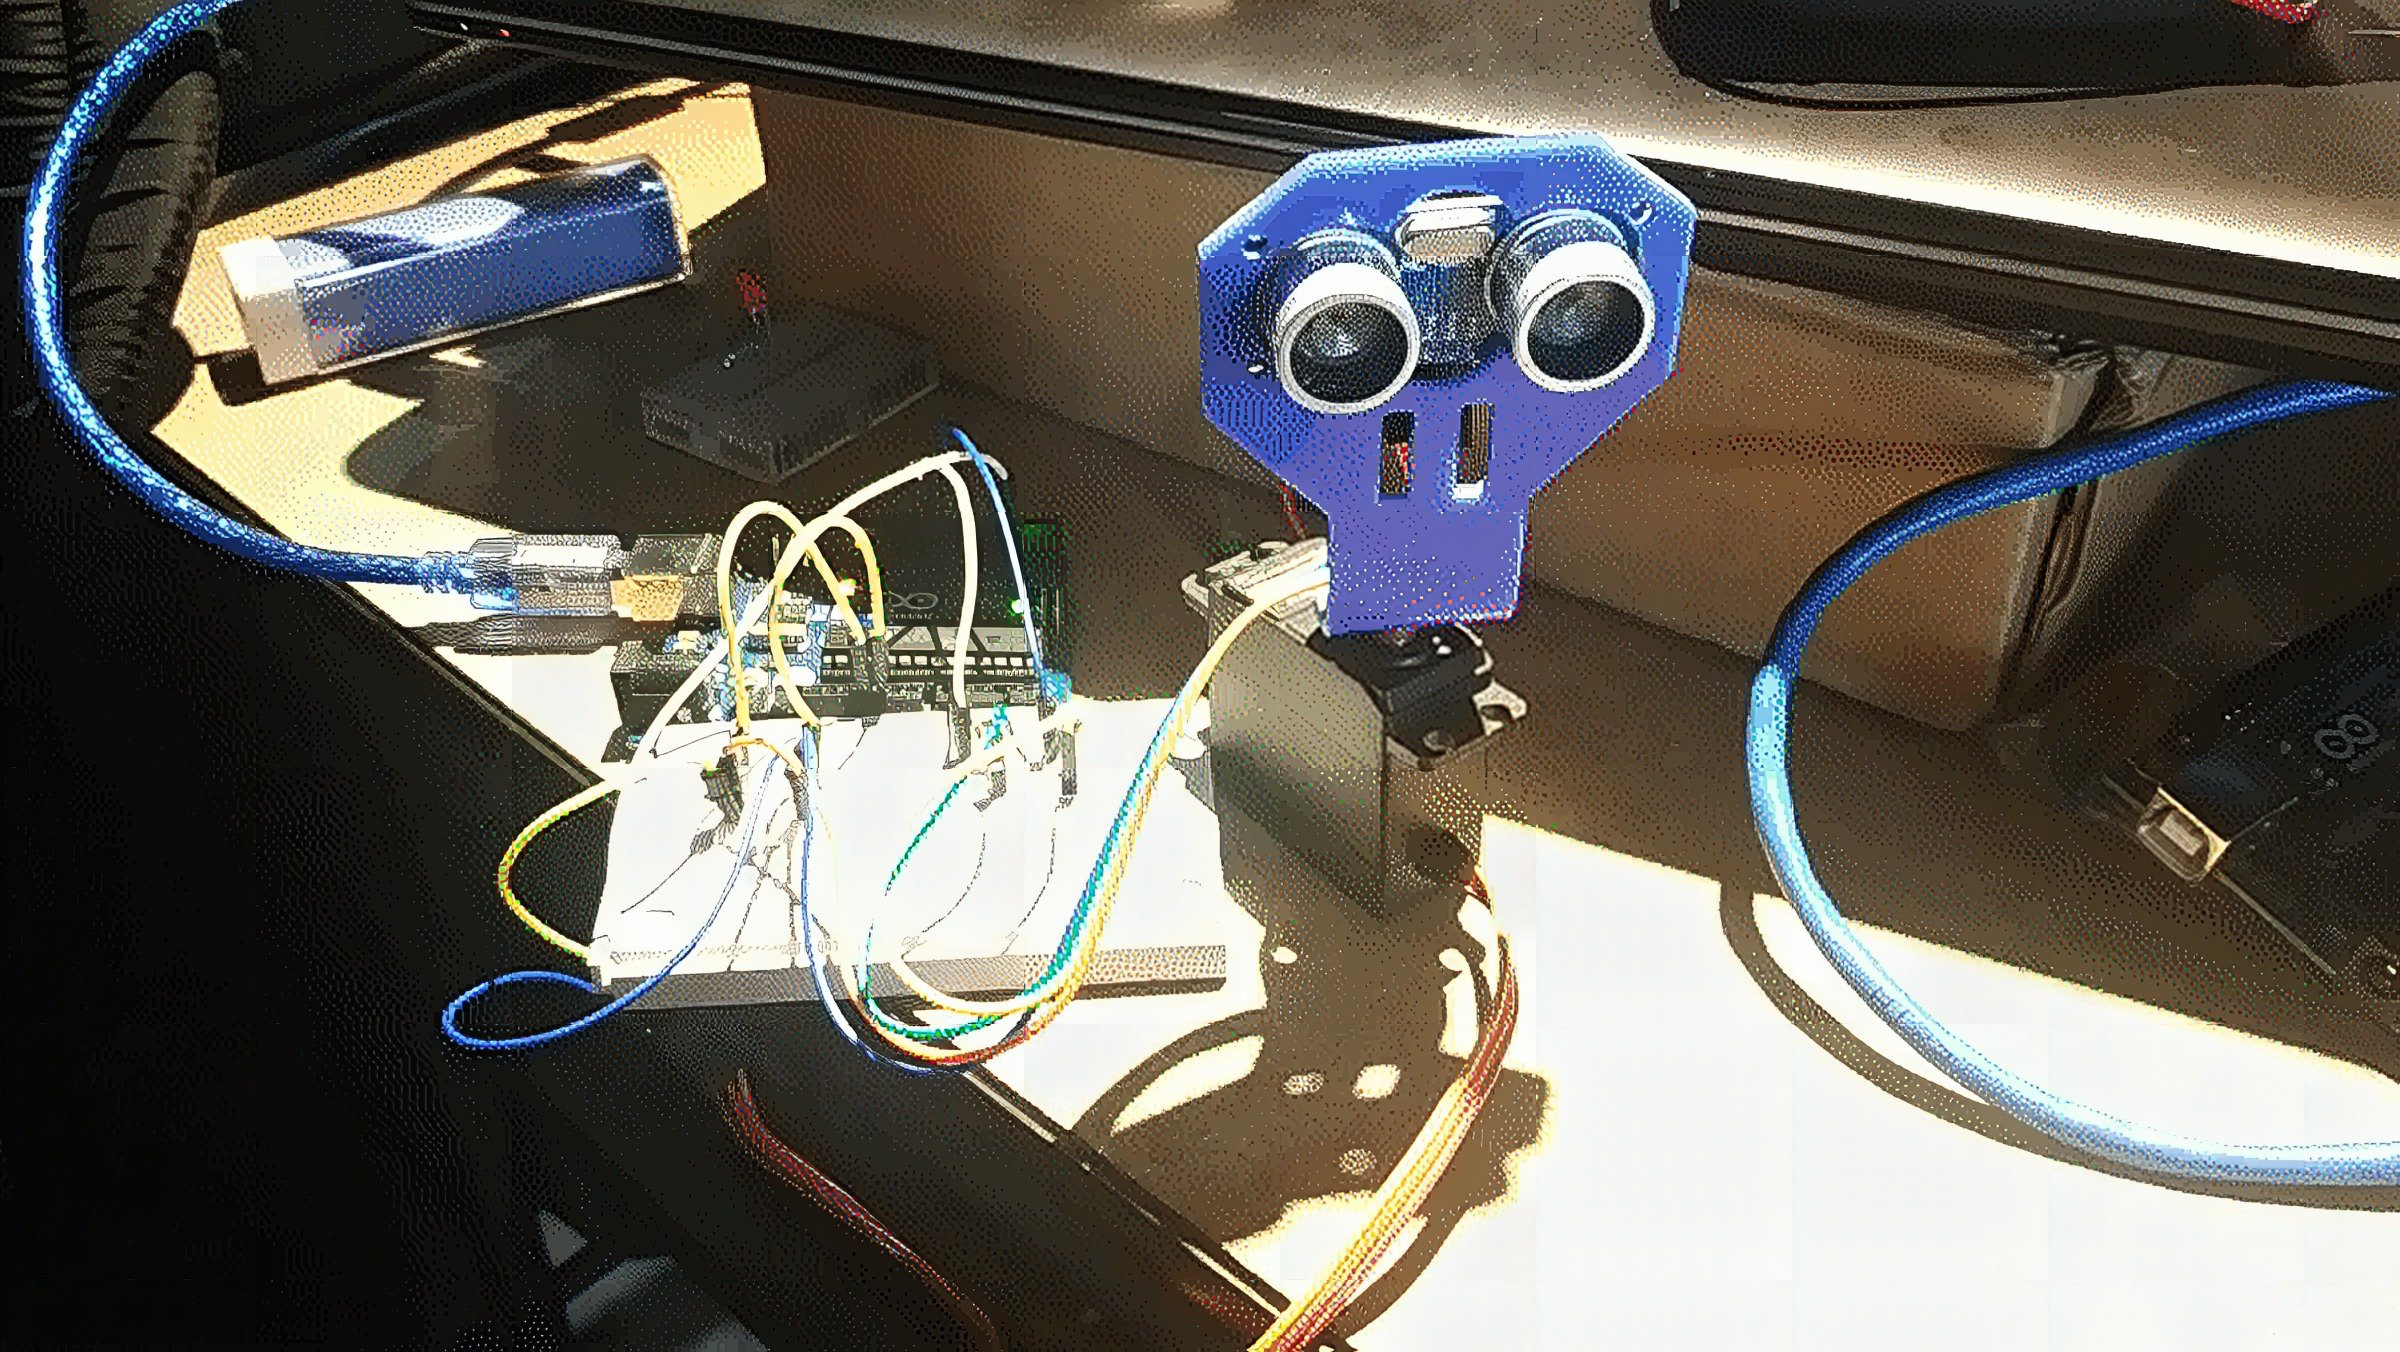
This sonar works with an Arduino as its brain. It controls the servo motor to sweep over a 180 degrees cycle with the ultrasonic sensor attached to it through a bracket. The data from the ultrasonic sensor travels to the Arduino then to the computer via serial to USB communication. The capacitors are used for decoupling.
Software
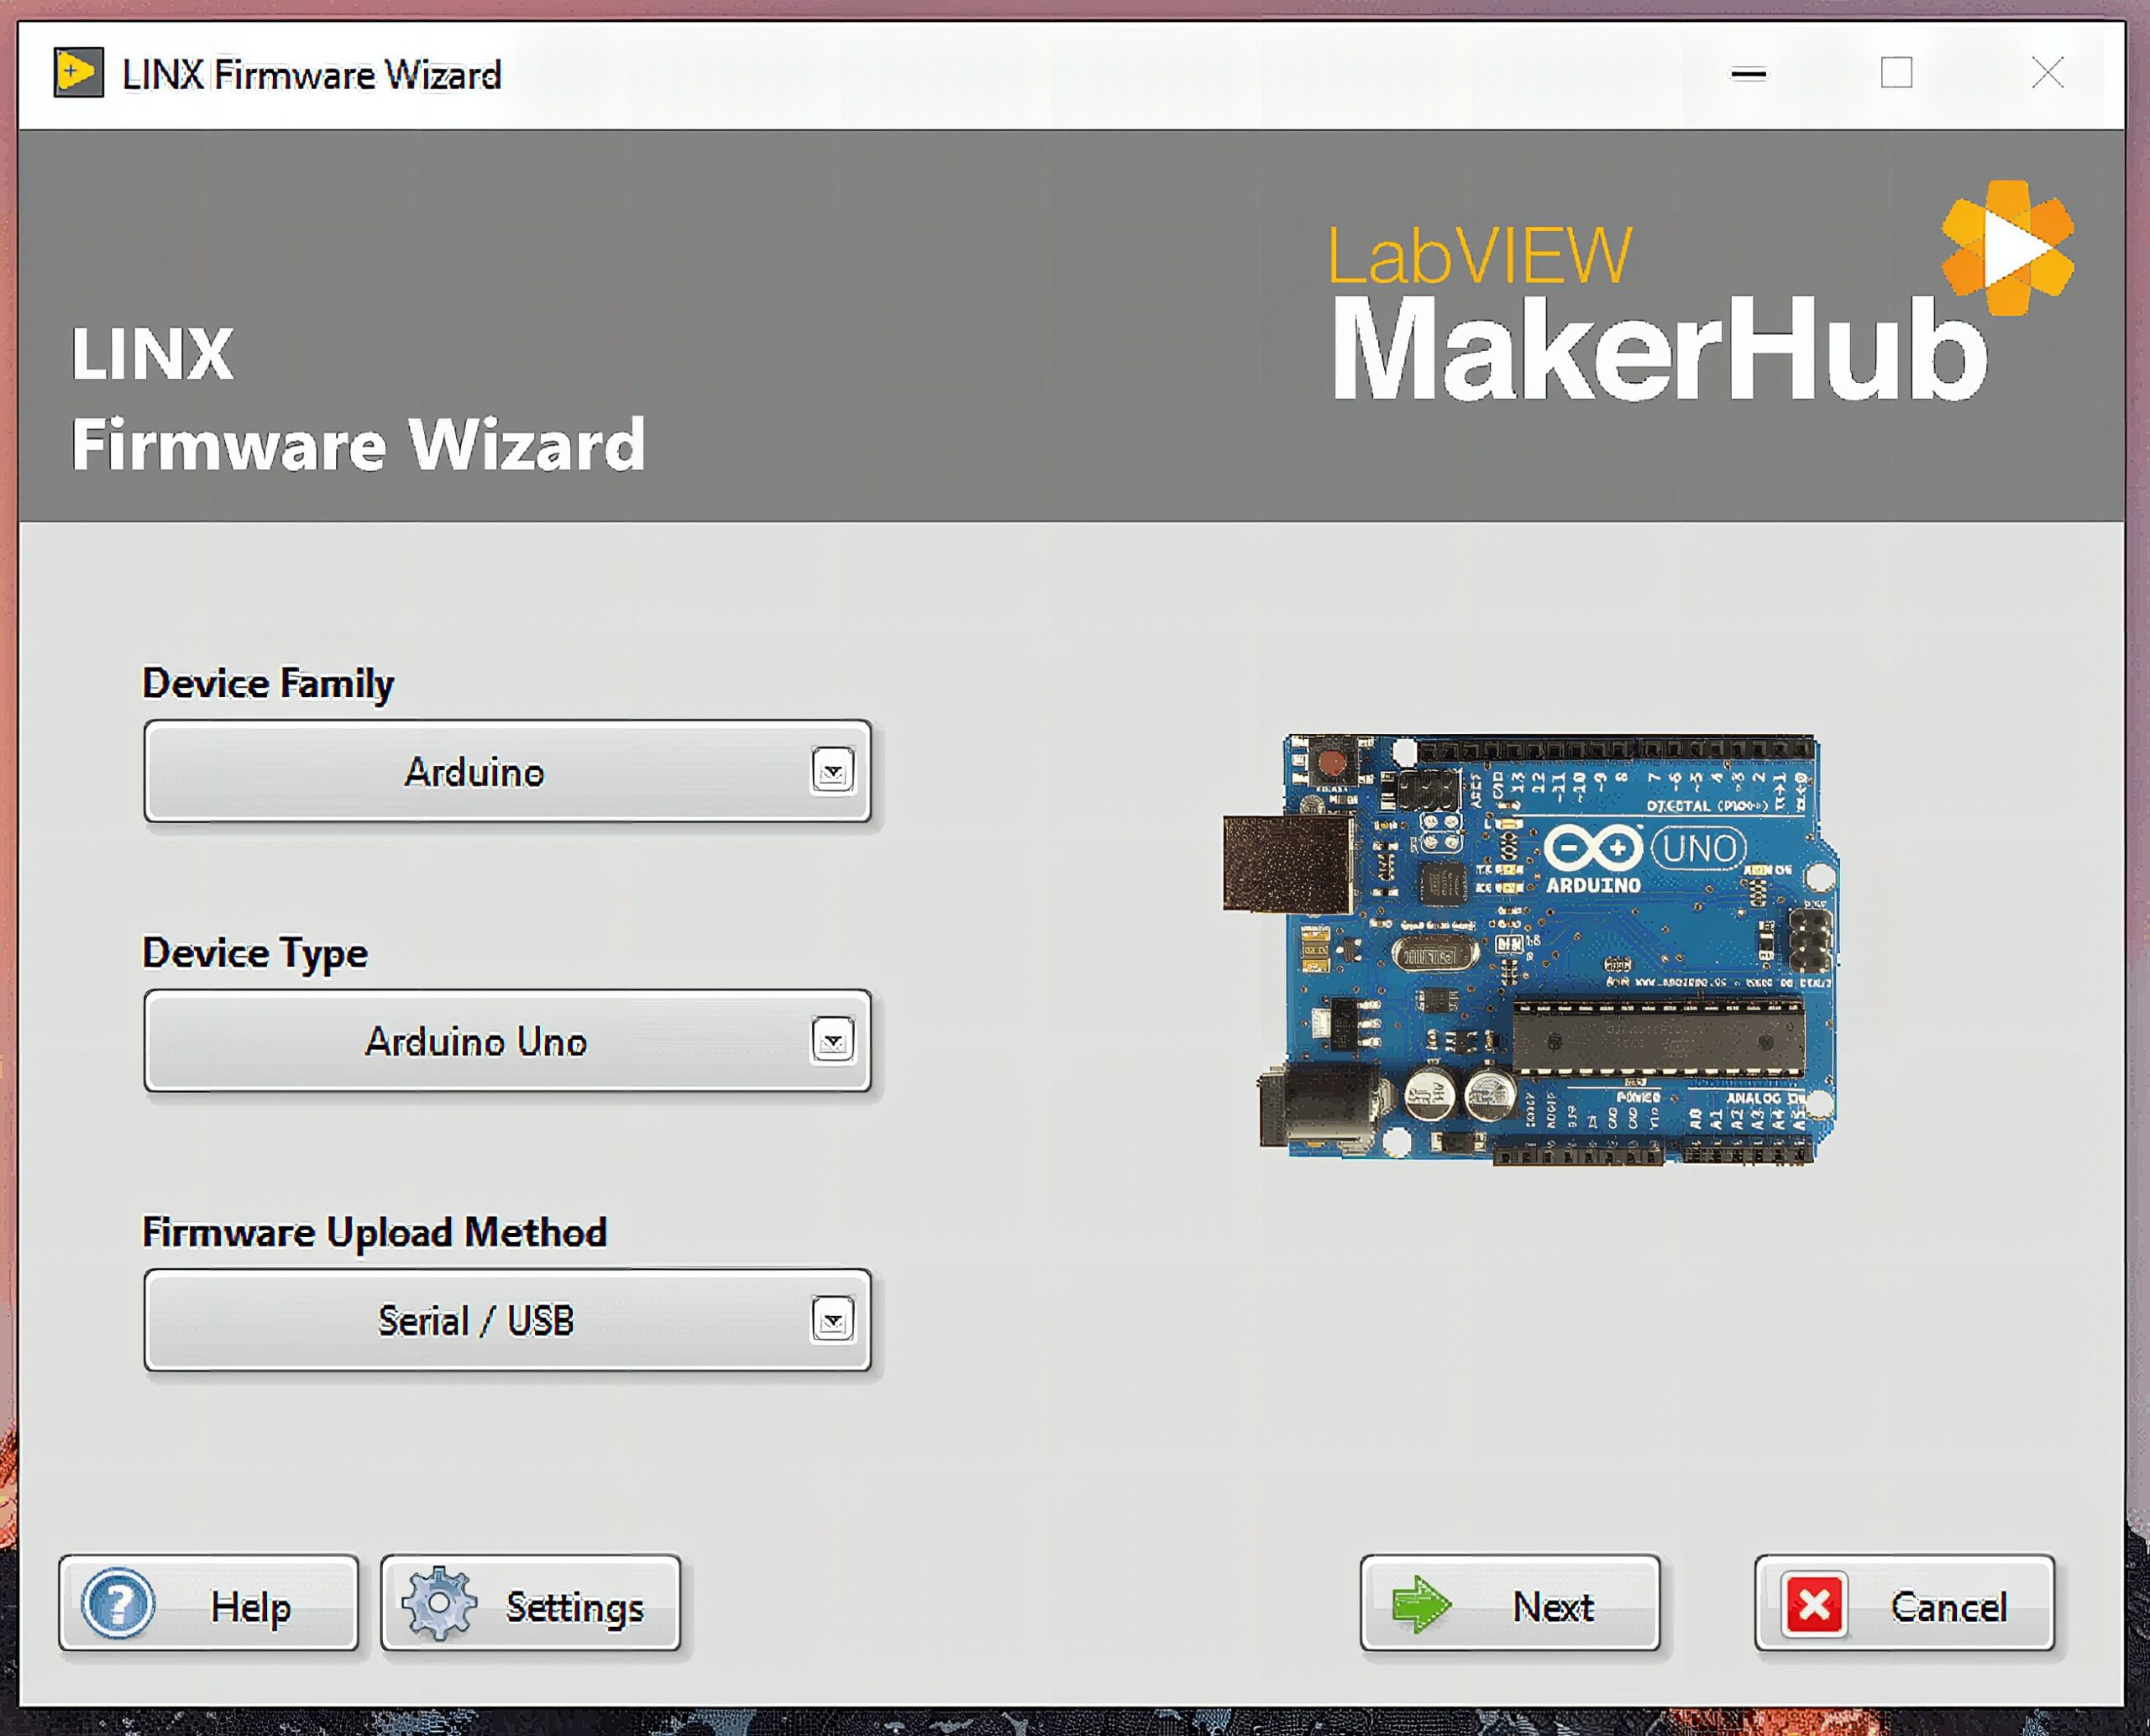
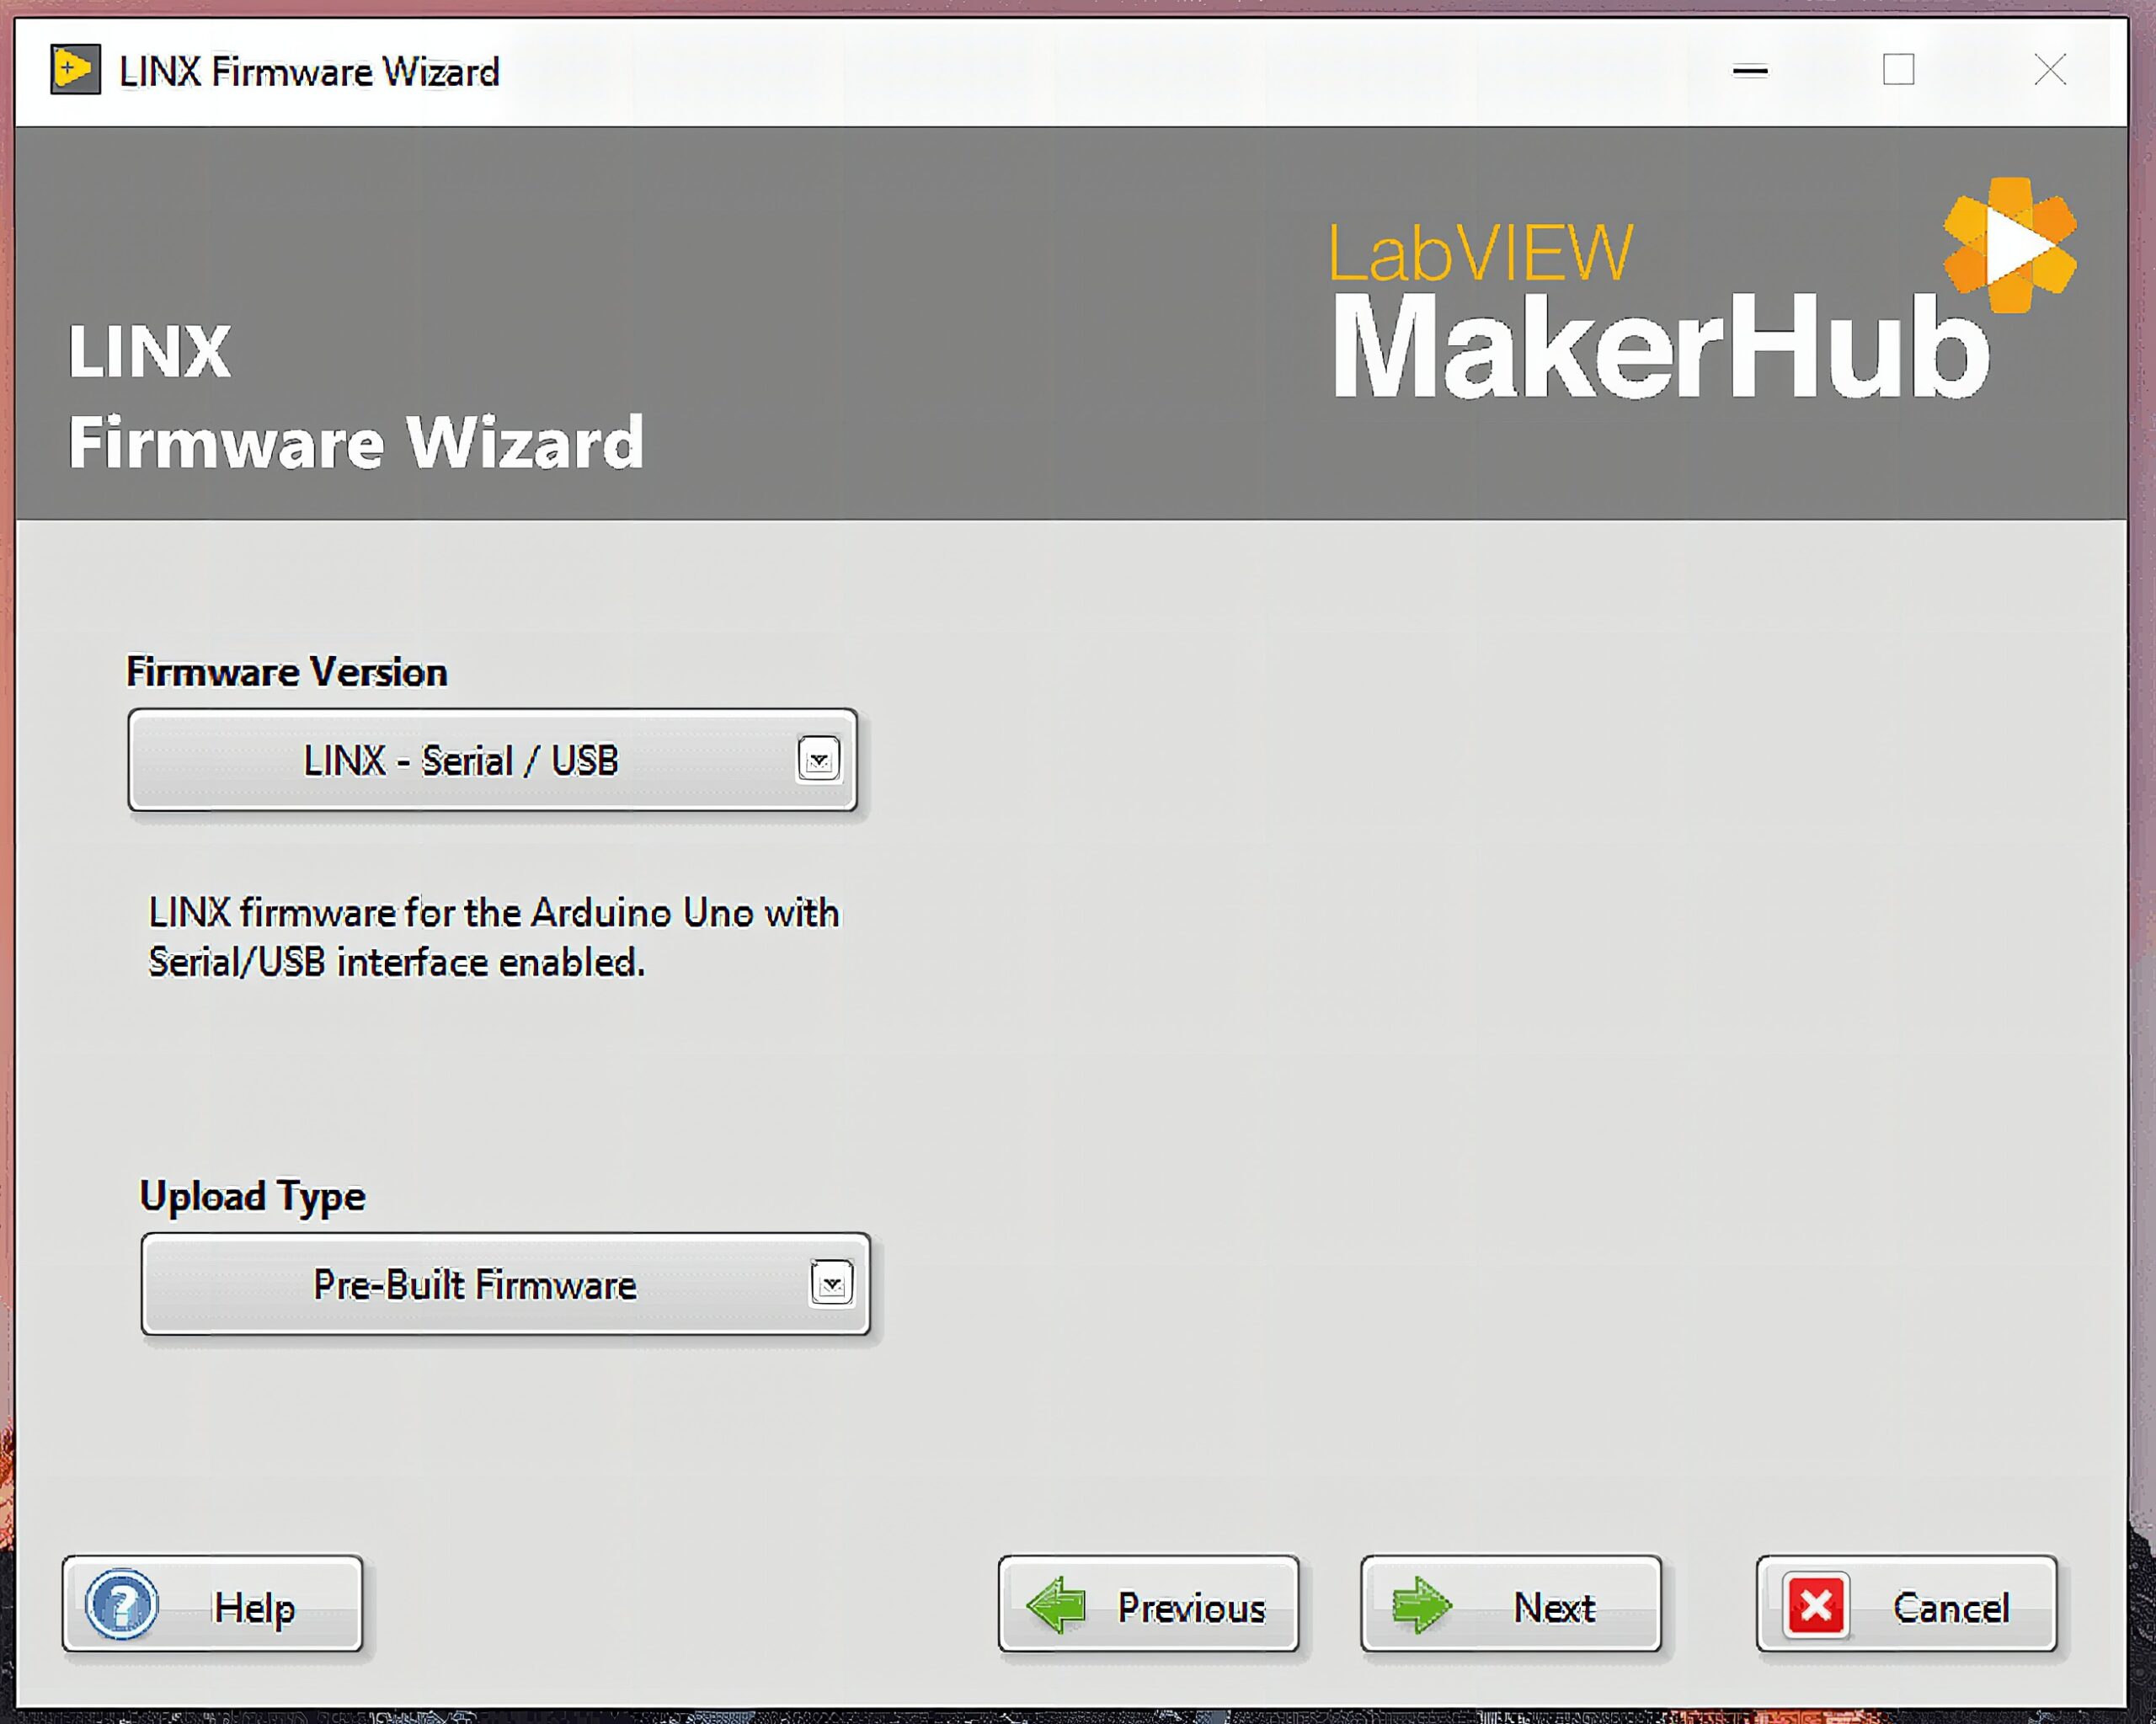
We need to upload a specific firmware in order to make LabVIEW communicate with the Arduino UNO. In the LabVIEW home screen, under Tools/Makerhub/LINX, open LINX Firmware Wizard.

Next you’ll indicate what board you’re using and what upload method you’re going to use. In this case, an Arduino UNO.
Select the COM port your Arduino is connected.
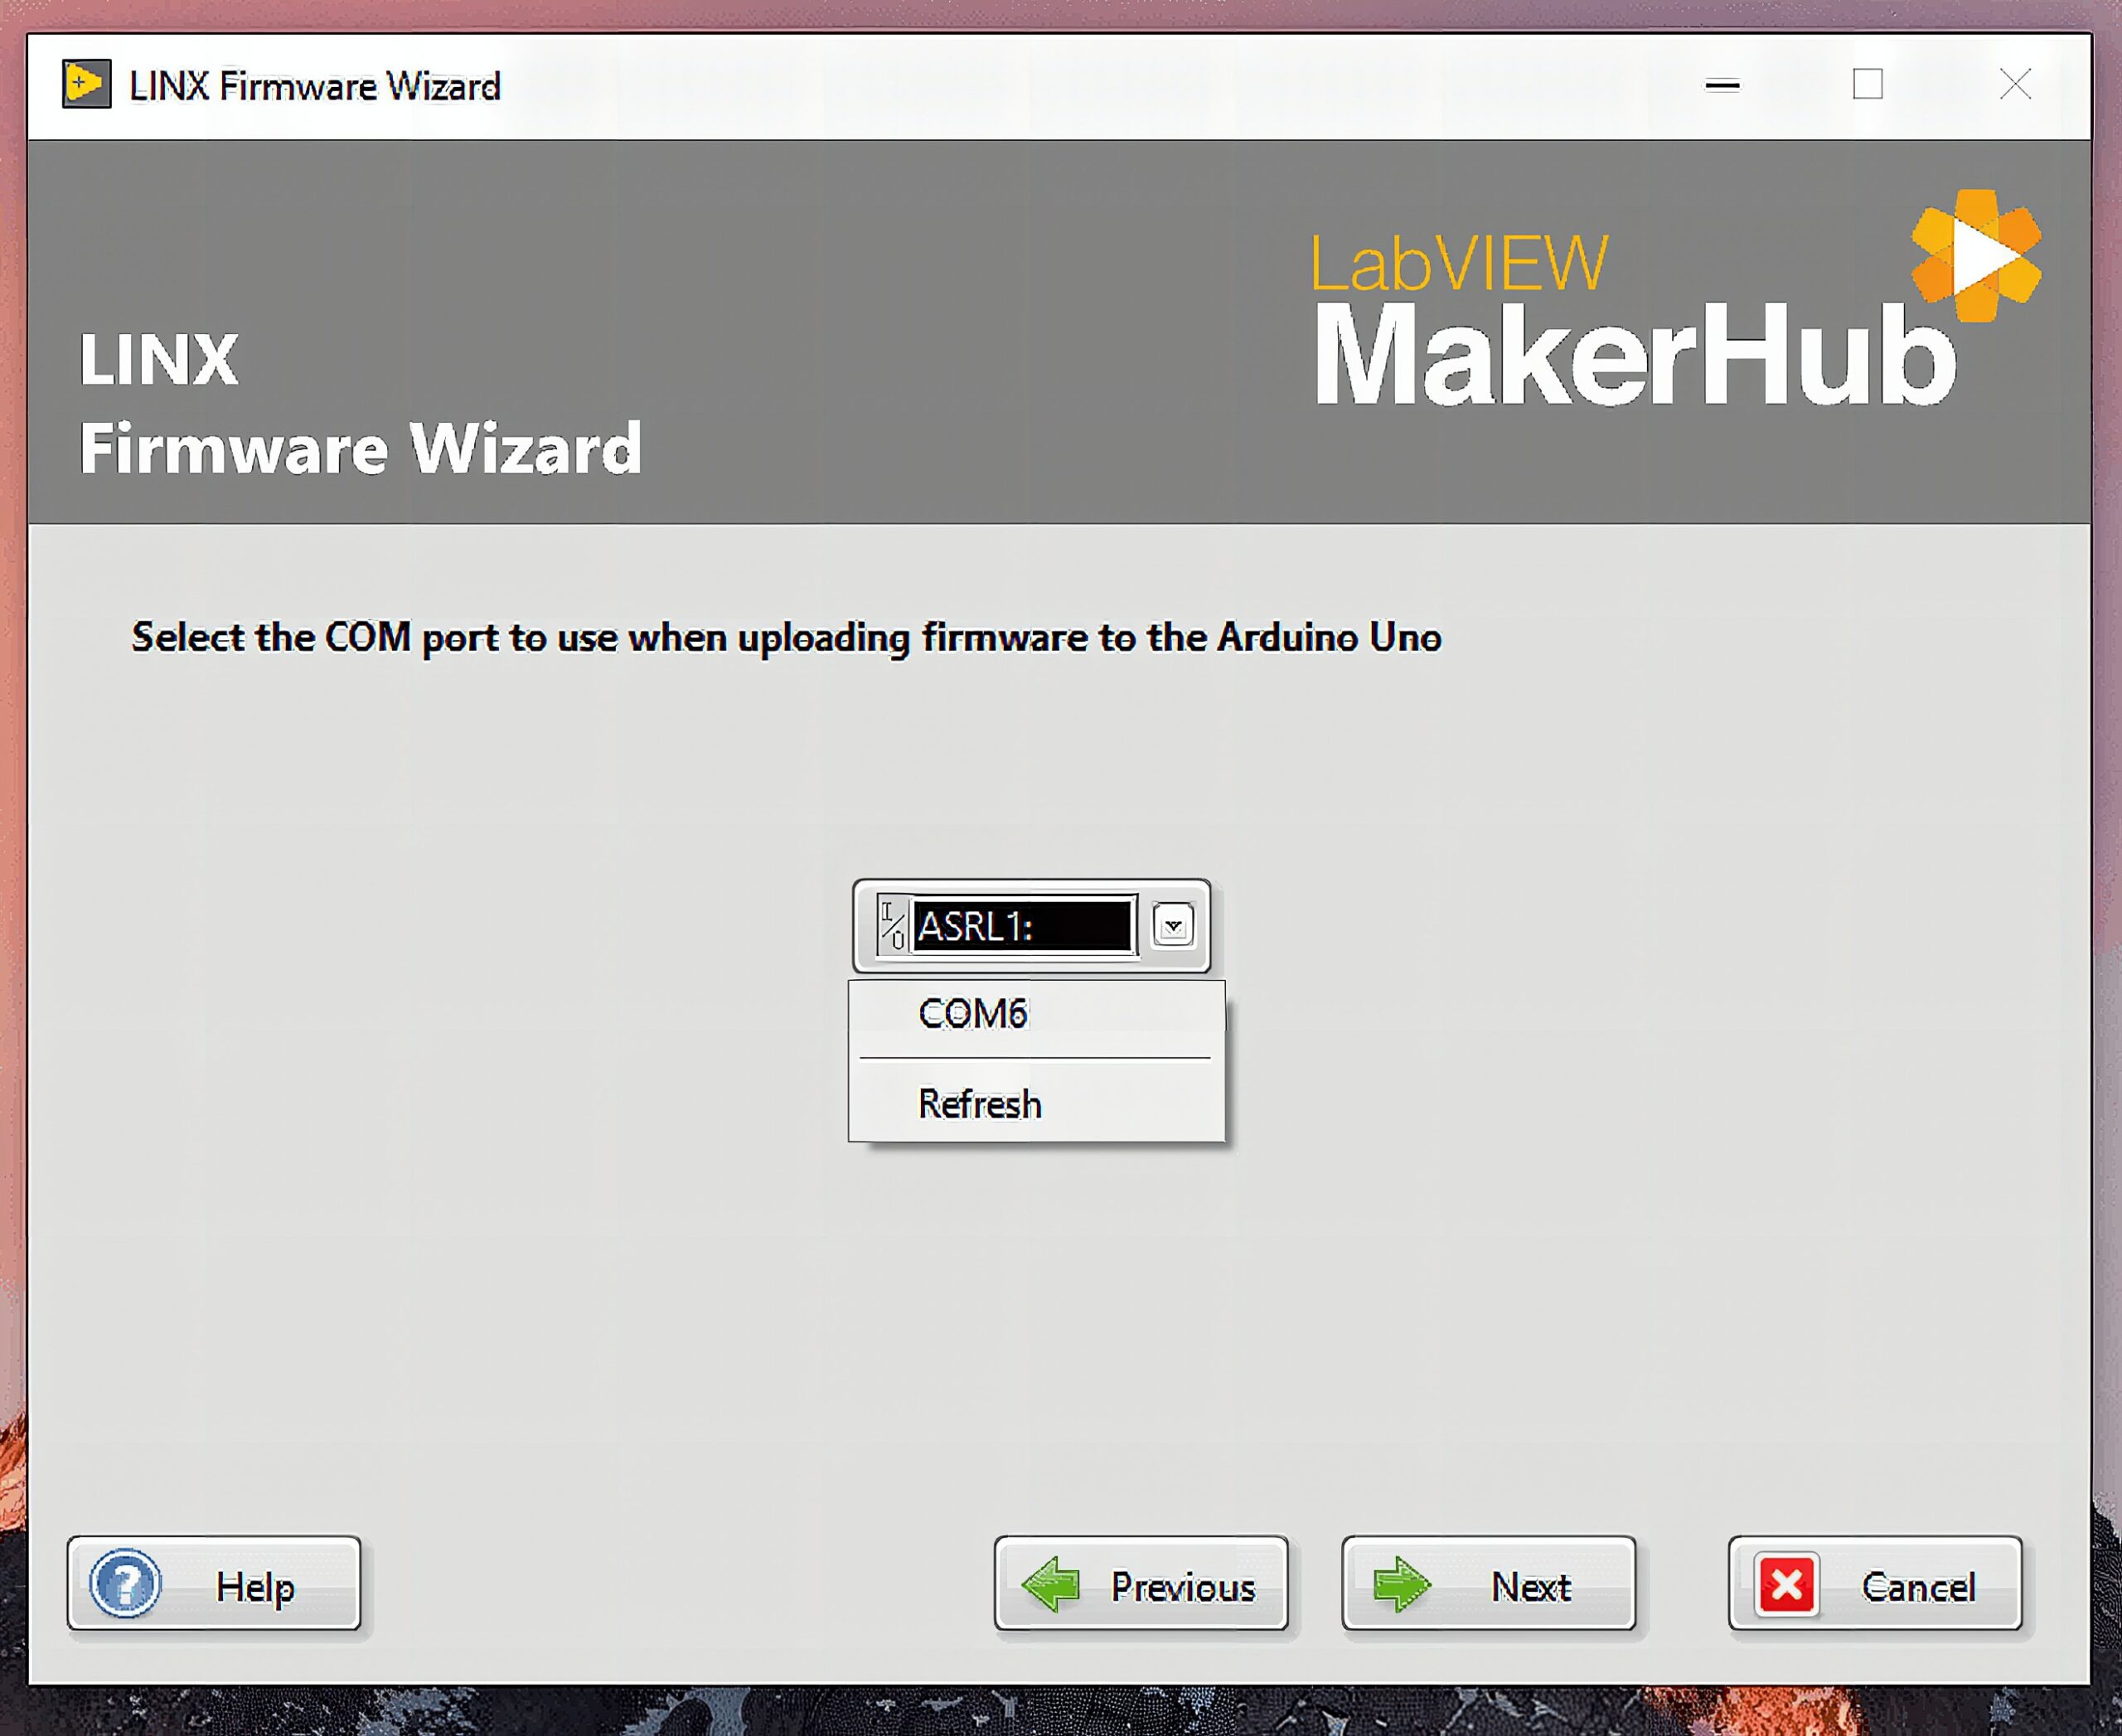
Choose Pre-built Firmware as the upload type.
Done!
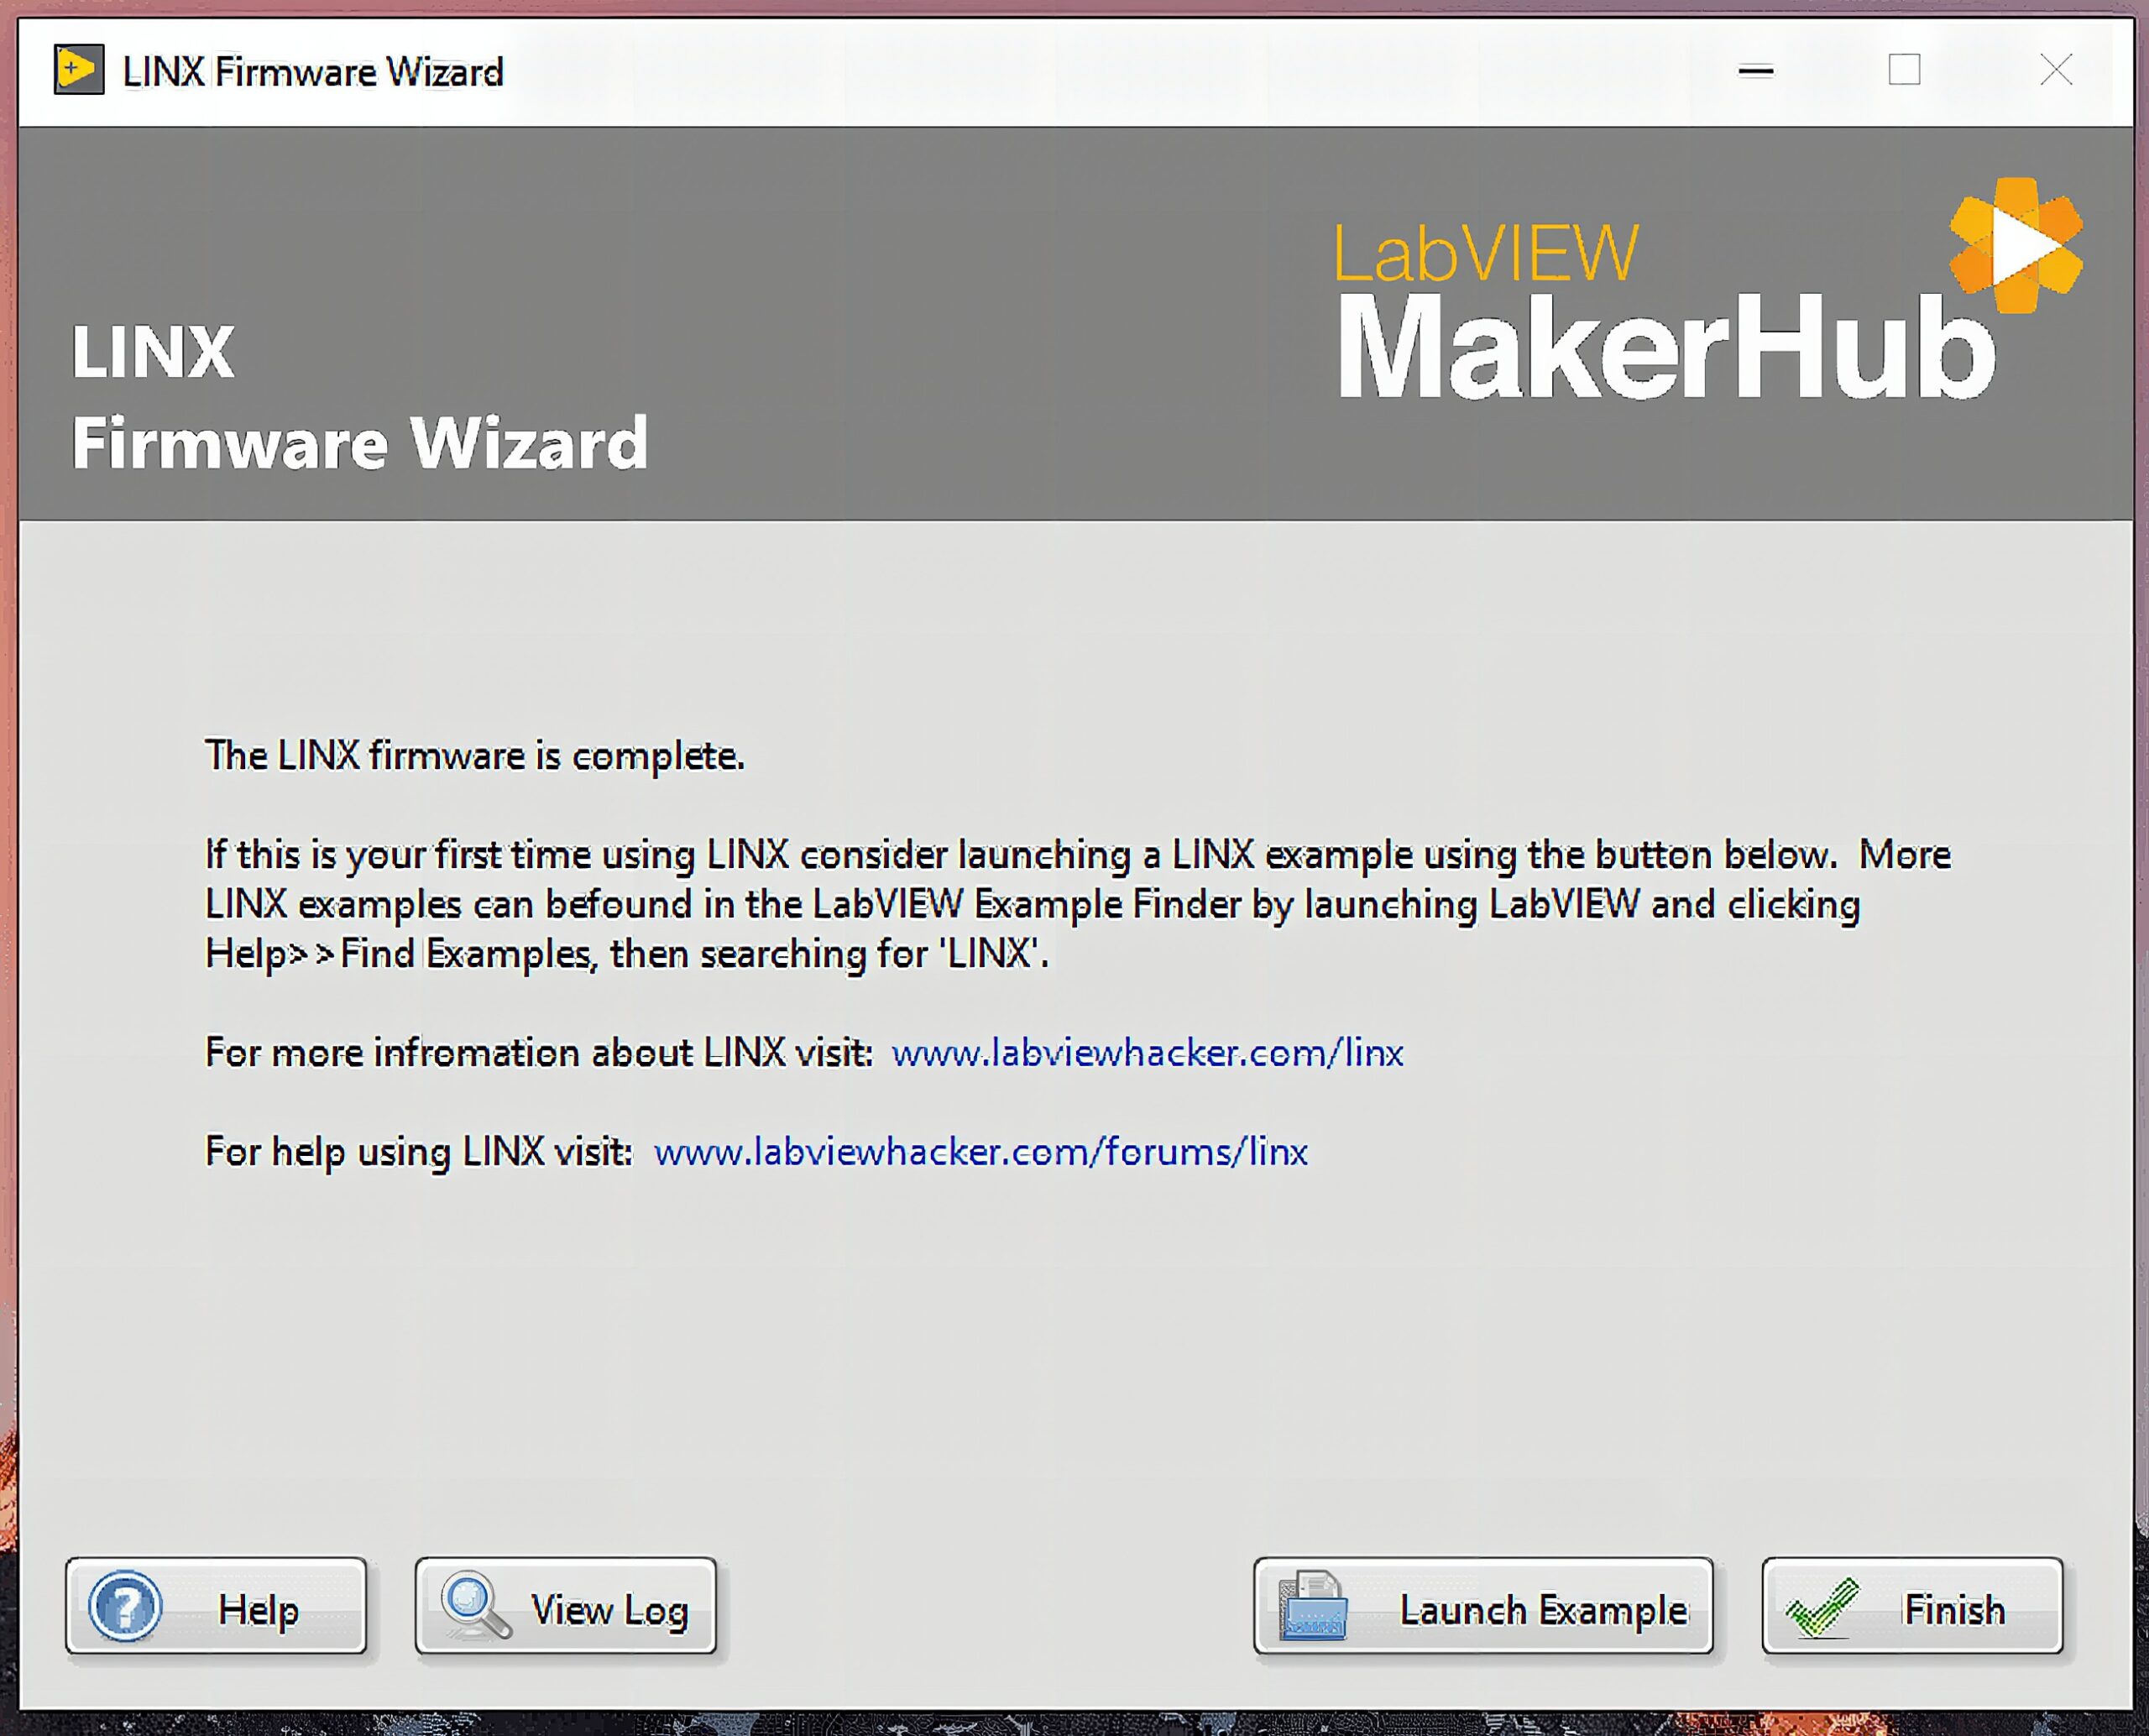
Click Finish to return to home screen. After this, your Arduino can now communicate with LabVIEW. Download the VIs I used here:
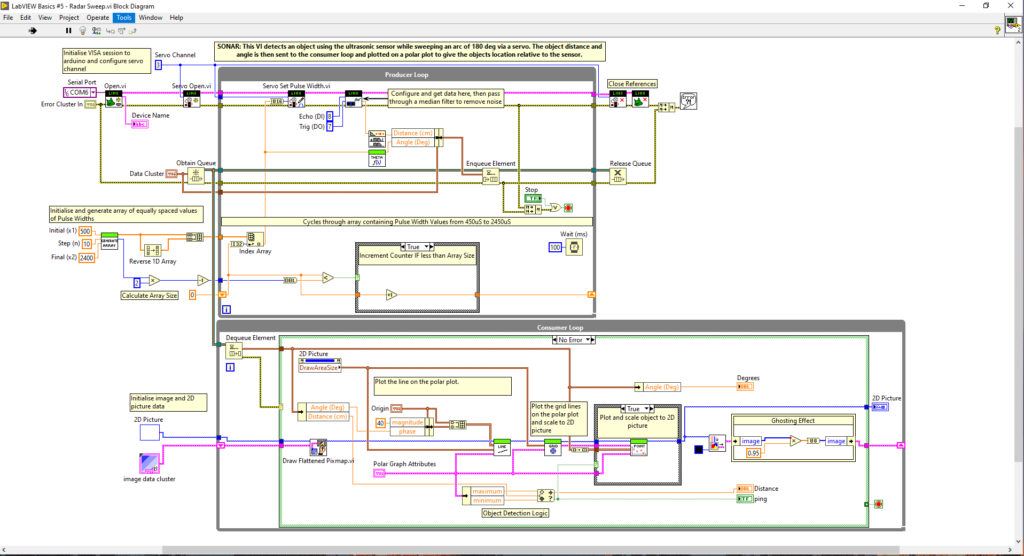
Open the sample file. Click CTRL + E to bring out the Block Diagram. Select the COM port of your Arduino UNO and run the program.
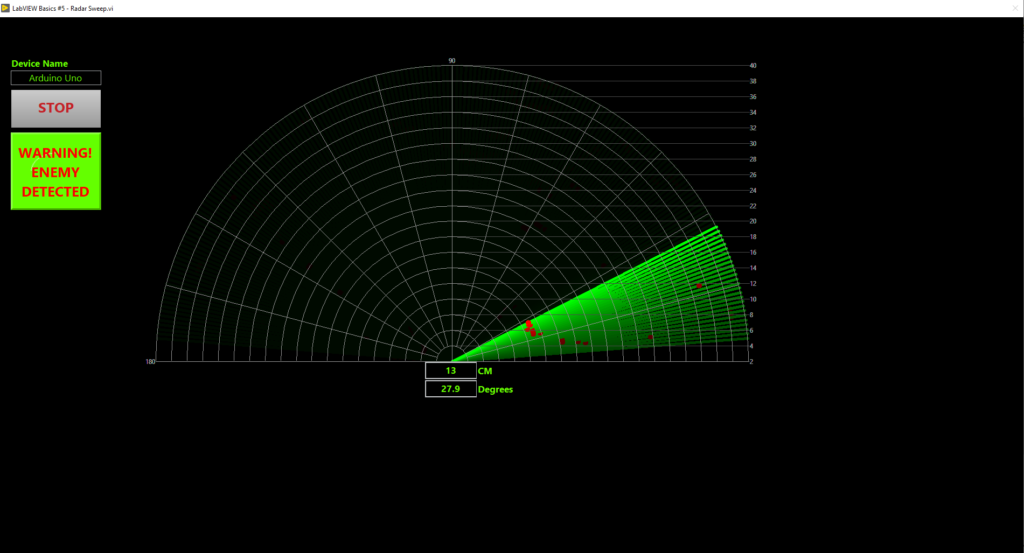
And that’s it! It’s quite fun relearning LabVIEW. It is indeed convenient for visualizing data for embedded systems.
Check out my previous post about making your own Arduino in a breadboard here. I also wrote some tips about preserving battery life for embedded systems. Check it out here. Stay creative!
References
- https://github.com/SINConsulting/LabVIEW-Basics
- https://www.labviewmakerhub.com/doku.php?id=learn:tutorials:labview:start
Frequently Asked Questions
[faq] [faq_q]What is LabVIEW?[/faq_q] [faq_a]LabVIEW is a visual programming environment from National Instruments, used in engineering and scientific instrumentation. You wire blocks together instead of writing code.[/faq_a][faq_q]Is LabVIEW free?[/faq_q] [faq_a]A free Community Edition exists for non-commercial use. Commercial licenses are paid. The article uses Community Edition, which is enough for hobby and learning projects.[/faq_a][faq_q]How does LabVIEW talk to Arduino?[/faq_q] [faq_a]Through the serial port. The article uses LINX (now LabVIEW MakerHub Toolkit), which provides a LabVIEW-side library for talking to Arduino and reading pins via simple blocks.[/faq_a][faq_q]What sonar sensor does this tutorial use?[/faq_q] [faq_a]HC-SR04 ultrasonic. Sends a pulse, measures the echo time, calculates distance. Common, cheap, and works fine for a visual-instrument tutorial.[/faq_a][faq_q]Can I use LabVIEW with ESP32 instead of Arduino?[/faq_q] [faq_a]Indirectly, yes. LabVIEW connects via serial, so any board that exposes a serial interface works. The LINX library specifically targets Arduino, but you can build your own protocol on top of serial for ESP32.[/faq_a][/faq]Frequently Asked Questions
What does this LabVIEW Tutorial: Making a Visual Instrument for an Arduino Sonar tutorial cover?
Visualize your data easily with a veteran in the engineering industry – National Instrument’s LabVIEW! It is a perfect solution to every makers’ test, measurement, and control needs.
What Arduino library does the LabVIEW Tutorial: Making a Visual Instrument for an Arduino Sonar tutorial use?
The sketch uses standard Wire.h (I2C) or SPI.h plus a part-specific library installable via Arduino IDE → Sketch → Include Library → Manage Libraries. See the Sample Code section.
Why does the LabVIEW Tutorial: Making a Visual Instrument for an Arduino Sonar act differently on USB power vs battery?
Battery voltage sags under load. Add a 100uF cap across the rails, use a 5V/2A regulator-backed pack, and never power motors from the Arduino's onboard regulator.